Killing Two Birds with One Paper
My last fall semester exam was for Social Economics class. Reading through packets of model summaries, I set out to determine which model – besides the obviously lovable Coate and Loury (1993) – I would most like to understand, remember, and explain. That is, I picked a paper to write about here… which I could also use in my intellectual battle with those pesky blue books.
It was in the middle of the lecture packet on “Intergenerational Mobility” that I found Bowles and Sethi (2006). This paper illustrates how magically ridding the world of discrimination (i.e., saying “assume no discrimination” as an economist) doesn’t necessarily lead to perfect convergence of group economic outcomes. In other words, even with zero discrimination, group differences in economic success can still persist across generations. Why is that? Because social networks matter for economic outcomes, and networks are often segregated by group identity. In the authors’ words,
“Group differences in economic success may persist across generations in the absence of discrimination against the less affluent group because racial segregation of friendship networks, mentoring relationships, neighborhoods, workplaces and schools places the less affluent group at a disadvantage in acquiring the things – contacts, information, cognitive skills, behavioral attributes – that contribute to economic success.”
Social networks are undeniably important in determining individuals’ economic outcomes. As such, building social network structures into models of human capital accumulation improves realism and allows for intriguing intergenerational theoretical results.
Bowles and Sethi (2006) appeals to me because the model formalizes dynamics touched on in many conversations about the long-term impacts of discriminatory practices. In this post I will lay out the model mechanics, explain proofs of the key results, and showcase a graph the authors use to visually illustrate their theoretical results.
Model Mechanics
The paper motivates the model with a few words on Brown v. Board and the black-white wage gap:
“Many hoped that the demise of legally enforced segregation and discrimination against African Americans during the 1950s and 1960s coupled with the apparent reduction in racial prejudice among whites would provide an environment in which significant social and economic racial disparities would not persist.”
Despite initial convergence from the 1950’s to the 1970’s, the gap has persisted. There are many reasons why this could be the case, continued practices of discrimination included. Bowles and Sethi use the following model to illustrate how such gaps could endure even absent discrimination.
In said model, a person is born into one of two groups – black or white – and lives for two periods. In the first period of life, she makes a decision about whether or not to acquire human capital and become ‘skilled.’ This is a simple binary choice. (She either becomes educated/trained or she does nothing.) In the second period, she is paid a wage based on her previous choice. If she didn’t acquire human capital (and thus isn’t skilled), she is paid a wage of $0$. If she did (and thus is skilled), she is paid a wage of $h$. In effect, the marginal benefit of human capital acquisition is h for all agents.
For the sake of simplicity, the model first assumes all people have the same ability. As such, an individual’s cost of human capital acquisition is solely dependent on the level of human capital in that person’s social network. Define network capital, $q$, as the fraction of agents in the network who chose to acquire human capital and are skilled. The key assumption in the model is that given the cost function $c(q)$, $c'(q)<0$. In words, the higher the fraction of skilled people in a person’s network, the less costly it is for the person to become skilled. Acquiring training is less costly when your network can connect you with opportunities and provide you with relevant information.
As per usual, agents choose to become skilled if marginal benefit exceeds marginal cost. Assume $c(0)>h>c(1)$ – that is, the cost of becoming skilled when no one in your network is skilled ($q=0$) is higher than the benefit of becoming skilled ($h$), but the cost when everyone is skilled ($q=1$) is lower than the benefit ($h$). In effect, there exists a unique threshold level $q^*$ such that $c(q^*)=h$. The agent’s decision rule is then:1
- for any
$q>q^*$, the agent chooses to becomes skilled - for any
$q<q^*$, the agent does not
While the decision rule is clear, how are social networks (and thus $q$’s) formed? We assume the population shares for $B$ (black) and $W$ (white) groups are $x$ and $1-x$, respectively. Moreover, agents born into the model in period $t+1$ have a large number of ties to those born in $t$. With probability $p \in [0,1]$ an associate is from same group ($B$ or $W$), but with probability ($1-p$) an associate is randomly picked from the general population of agents (could be either group). As such, the parameter $p$ is the degree of “in-group bias” or segregation. Assume the parameter is the same for both groups. Therefore, the probability that: a black agent’s connection is also black is $p+(1-p)x$, a white agent’s connection is also white is $p+(1-p)(1-x)$, a black agent’s connection is white is $(1-p)(1-x)$, and a white agent’s connection is black is $(1-p)x$.
The network capital in $t+1$ depends on the mechanical formation of the agent’s group and human capital accumulation decisions made by black and white agents born in time $t$ (represented by $s^B_t$ and $s^W_t$, respectively):
$$q^B_{t+1}=[p+(1-p)x] s^B_t + [(1-p)(1-x)] s^W_t$$
$$q^W_{t+1}=[(1-p)x] s^B_t + [p+(1-p)(1-x)] s^W_t$$
The above equations show that (for both groups) the fraction of connections in an agent’s network (born in $t+1$) who are skilled is:
(chance of black associate)(fraction of black agents born in t who are skilled) +
(chance of white associate)(fraction of white agents born in t who are skilled)
The network capital of people in the two groups is the same only if: $p=0$ (there is no segregation), or $s^W_t=s^B_t$ (there is no initial group inequality in human capital).
Given the two above equations, we get a “law of motion” for human capital decisions:
- If
$q^G_{t+1}>q^*, s^G_{t+1}=1$(with$G \in \{B,W\}$) - If
$q^G_{t+1}<q^*, s^G_{t+1}=0$
In words, if network capital is above the necessary threshold level, all agents of that group become skilled. If network capital is below the necessary threshold level, all agents of that group stay unskilled. Note that in this simplified model all agents make the same decisions within racial groups.
From Parameter Values to Group Outcomes
How do we get real-world implications from this model? We know black people have been historically economically disadvantaged in the United States. But, how do we integrate this fact into the model’s framework? Well, we can set the initial state of the world to the extreme $(sB, sW)=(0,1)$, meaning all black agents start of as unskilled and all white agents start of as skilled (perhaps due to separate but unequal hospitals/schools/etc). Based on that initial state, I can then see what the future states of the world will be under the previously derived law of motion.
- Let’s assume complete integration,
$p=0$. Given$(sB, sW)=(0,1)$, then$q^W_{t+1}=q^B_{t+1}=1-x$, and since cost is only dependent on network, cost is then$c(1-x)$for both groups. Thus, all black and white agents will make the same decisions and there will be no asymmetric stable steady state. - Now, consider complete segregation,
$p=1$. Given$(sB, sW)=(0,1)$again, then$q^B=0$and$q^W=1$. So, cost is$c(0)$for black agents and$c(1)$for white agents. Recall$c(0)<h<c(1)$, meaning that there is necessarily an asymmetric stable steady state. (No black agents will become skilled and all white agents will become skilled.)
Given #1 and #2 above, the authors explain,
“Since there exists an asymmetric stable steady state under complete segregation but none under complete integration, one may conjecture that there is a threshold level of segregation such that persistent group inequality is feasible if and only if the actual segregation level exceeds this threshold.”
Let’s prove this conjecture. (The following is my summary of the appendix proofs for propositions 1 and 2.) First, we find the unique $x''$ (black population share) threshold s.t. $c(1-x'')=h$. Then,
-
consider
$x'<x''$$c(1-x')<h$because cost decreases in its argument$q^B=(1-p)(1-x')$and$q^W=p+(1-p)(1-x')$(since$(s^B, s^W)=(0,1)$)$c(q^W)$is decreasing in$p$and less than$h$at$p=0$(since$c(1-x')<h$)$c(q^B)$is increasing in$p$and$c(q^B)=c((1-0)(1-x'))<h$when$p=0$but$c(q^B)=c(0)>h$when$p=1$- there is a unique
$p'(x')$such that$c(q^B)=h$- for all
$p>p'(x')$, we have$c(q^W)<h<c(q^B)$, meaning$(s^B,s^W)=(0,1)$is a steady state - for all
$p<p'(x')$, we have$c(q^W)<c(q^B)<h$, which makes it optimal for both groups of workers to become skilled and so there is a transition to$(1,1)$- since that lowers both costs, the condition
$c(q^W)<c(q^B)<h$continues to hold which makes$(1,1)$the stable steady state instead of$(0,1)$.
- since that lowers both costs, the condition
- for all
- there is a unique
-
consider
$x'>x''$$c(1-x')>h$because cost decreases in its argument$q^B=(1-p)(1-x')$and$q^W=p+(1-p)(1-x')$(since$(s^B, s^W)=(0,1)$)$c(q^B)$is increasing in$p$and greater than$h$when$p=0$(since$c(q^B)=c(1-x')>h$);$c(q^B)>h$for all$p$$c(q^W)$is decreasing in$p$and$c(q^W)=c((1-0)(1-x'))>h$when$p=0$but$c(q^W)=c(1)<h$when$p=1$- there is a unique
$p'(x')$such that$c(qW)=h$- for all
$p>p'(x')$, we have$c(q^W)<h<c(q^B)$, meaning$(s^B,s^W)=(0,1)$is a steady state - for all
$p<p'(x')$, we have$h<c(q^W)<c(q^B)$, which makes it optimal for both groups of workers to not become skilled and so transition to$(0,0)$- since that then increases both costs, the condition
$h<c(q^W)<c(q^B)$continues to hold which makes$(0,0)$the stable steady state instead of$(0,1)$
- since that then increases both costs, the condition
- for all
- there is a unique
In sum, given the fraction $x$, there is a threshold level of segregation $p^*$ above which $(sB,sW)=(0,1)$ is a steady state (persistent group inequality), but below which the model shifts to a symmetric steady state. Whether the eventual steady state means welfare improving equalization – $(sB,sW)=(1,1)$ – or welfare reducing equalization – $(sB,sW)=(0,0)$ – depends on the fraction $x$. If the originally skilled group is large enough, all agents will become skilled, otherwise, all agents will become unskilled.
In words, the model shows that group inequality persists if segregation is high enough. If segregation is below the threshold for maintaining inequality, groups inequality disappears, but whether that is through a loss of everyone’s skills or a gain of everyone’s skills depends on the population shares that define the model world. The authors use the following graph to depict these conclusions:
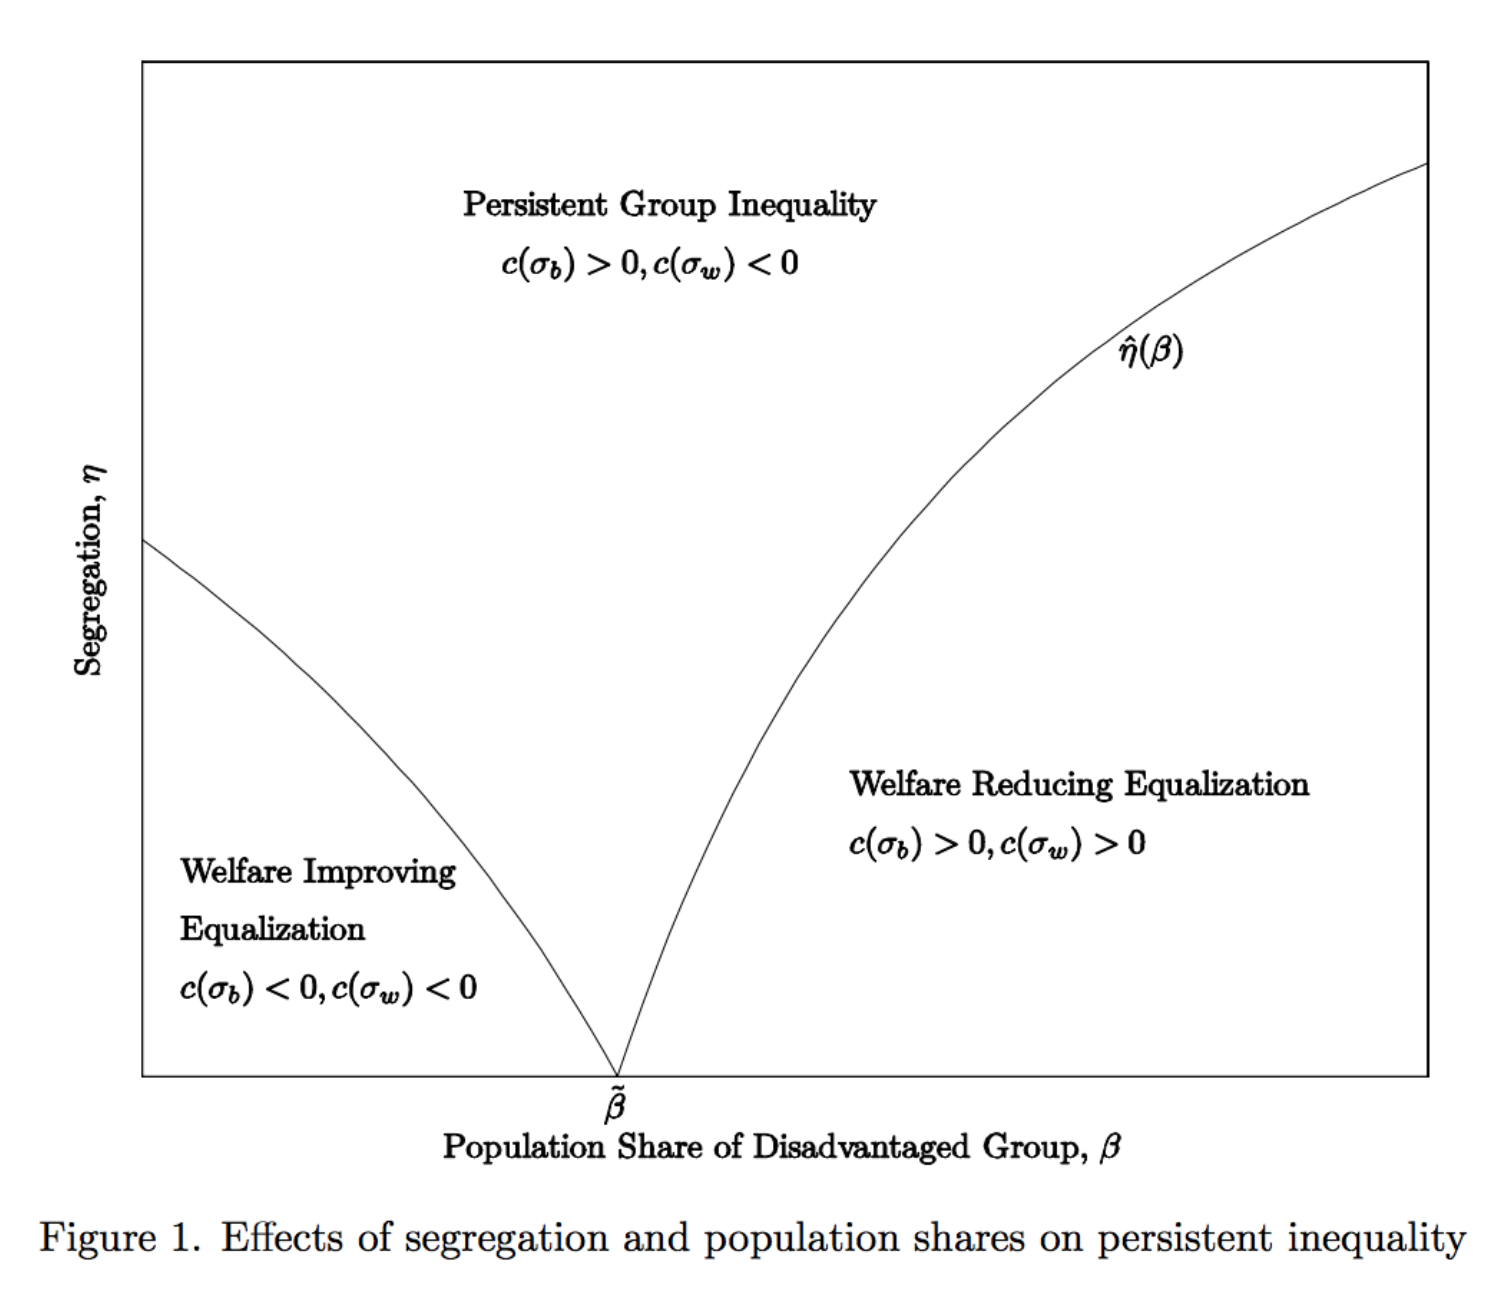
This figure sharply summarizes the model’s results thus far. It succinctly and clearly shows how two parameters (population share and segregation) determine the eventual state of the world. I usually use graphs to visualize tangible data, but they are just as useful in visualizing concepts or theoretical results, as seen here.2
Suspiciously Slick?
There are a few issues with the model dynamics that you might have noticed reading the above summary. Namely, everyone is the same within racial groups and convergence occurs in a single period. This feels less interesting than a slower convergence differing by other individual characteristics.
Much of the aforementioned simplicity comes from the assumption that ability is the same for all agents (ability is homogenous). However, the model can be tweaked to make ability heterogenous – that is exactly what the authors do later in the paper. As such, the cost of human capital investment then varies with ability as well as network capital. So, cost now depends on something that is specific to the individual (ability) as well as common to the group (racial identity).3
Moreover, the cost function $c(a, q)$ is then decreasing in both ability and network capital level. In words, it is easier to become skilled when exposed to more skilled people (due to networks), and easier to become skilled when endowed with higher natural ability. For any given network capital level $q$, there is some threshold ability level $a'(q)$ such that those above the cut-off become skilled and those below do not. Similar to the reasoning in the homogenous case, an agent needs $c(a, q)<h$ to become skilled. In effect, the relevant threshold is defined as the $a'(q)$ s.t. $c(a, q)=h$.4
An interesting insight on this topic is that: “individuals belonging to groups exposed to higher levels of human capital will themselves accumulate human capital at lower ability thresholds relative to individuals in groups with initially lower levels of human capital. This difference will be greater when segregation levels are high.” So, in this more complex build of the model, black people have to boast higher ability levels than their white counterparts to make human capital accumulation cost beneficial… all due to the historical disadvantages build into their social networks. And that all came out of a bunch of threshold rules and variables!
Recap: Behold the Power of Models
Bowles and Sethi built this model with an eye towards examples of enduring economic injury. They saw an empirical fact (the persistent black-white wage gap) and then put structure on their intuitive answers to naturally occurring questions: If there was zero discrimination, would the wage gap still endure? How would that work? Through what channels?
At the end of the day, their model hinges on a few items: (1) the inverse relationship between network capital and cost of skill acquisition, and (2) network formation (as influenced by segregation and population share). The first is an assumption based in the reality of human success and failure – it doesn’t always “take a village” but that definitely helps. The second is a distilled sketch of a complex and idiosyncratic process – network formation depends on two parameters (segregation and population share) and leads to useful, comprehensible insights. The previously showcased graph is especially important for highlighting the potential difficulty of policy decisions – what part of the graph are we in?
Blue Book’d
Bowles and Sethi (2006) illustrates how social networks, population demographics, and decision-making interact to determine the endurance of economic injury. The model also illustrates how writing a blog can sometimes help in your academic life – as it turns out, I managed to describe and solve out pieces of this model in my Social Economics blue book exam. Two birds, one paper.
-
I’ll ignore indifference throughout. ↩︎
-
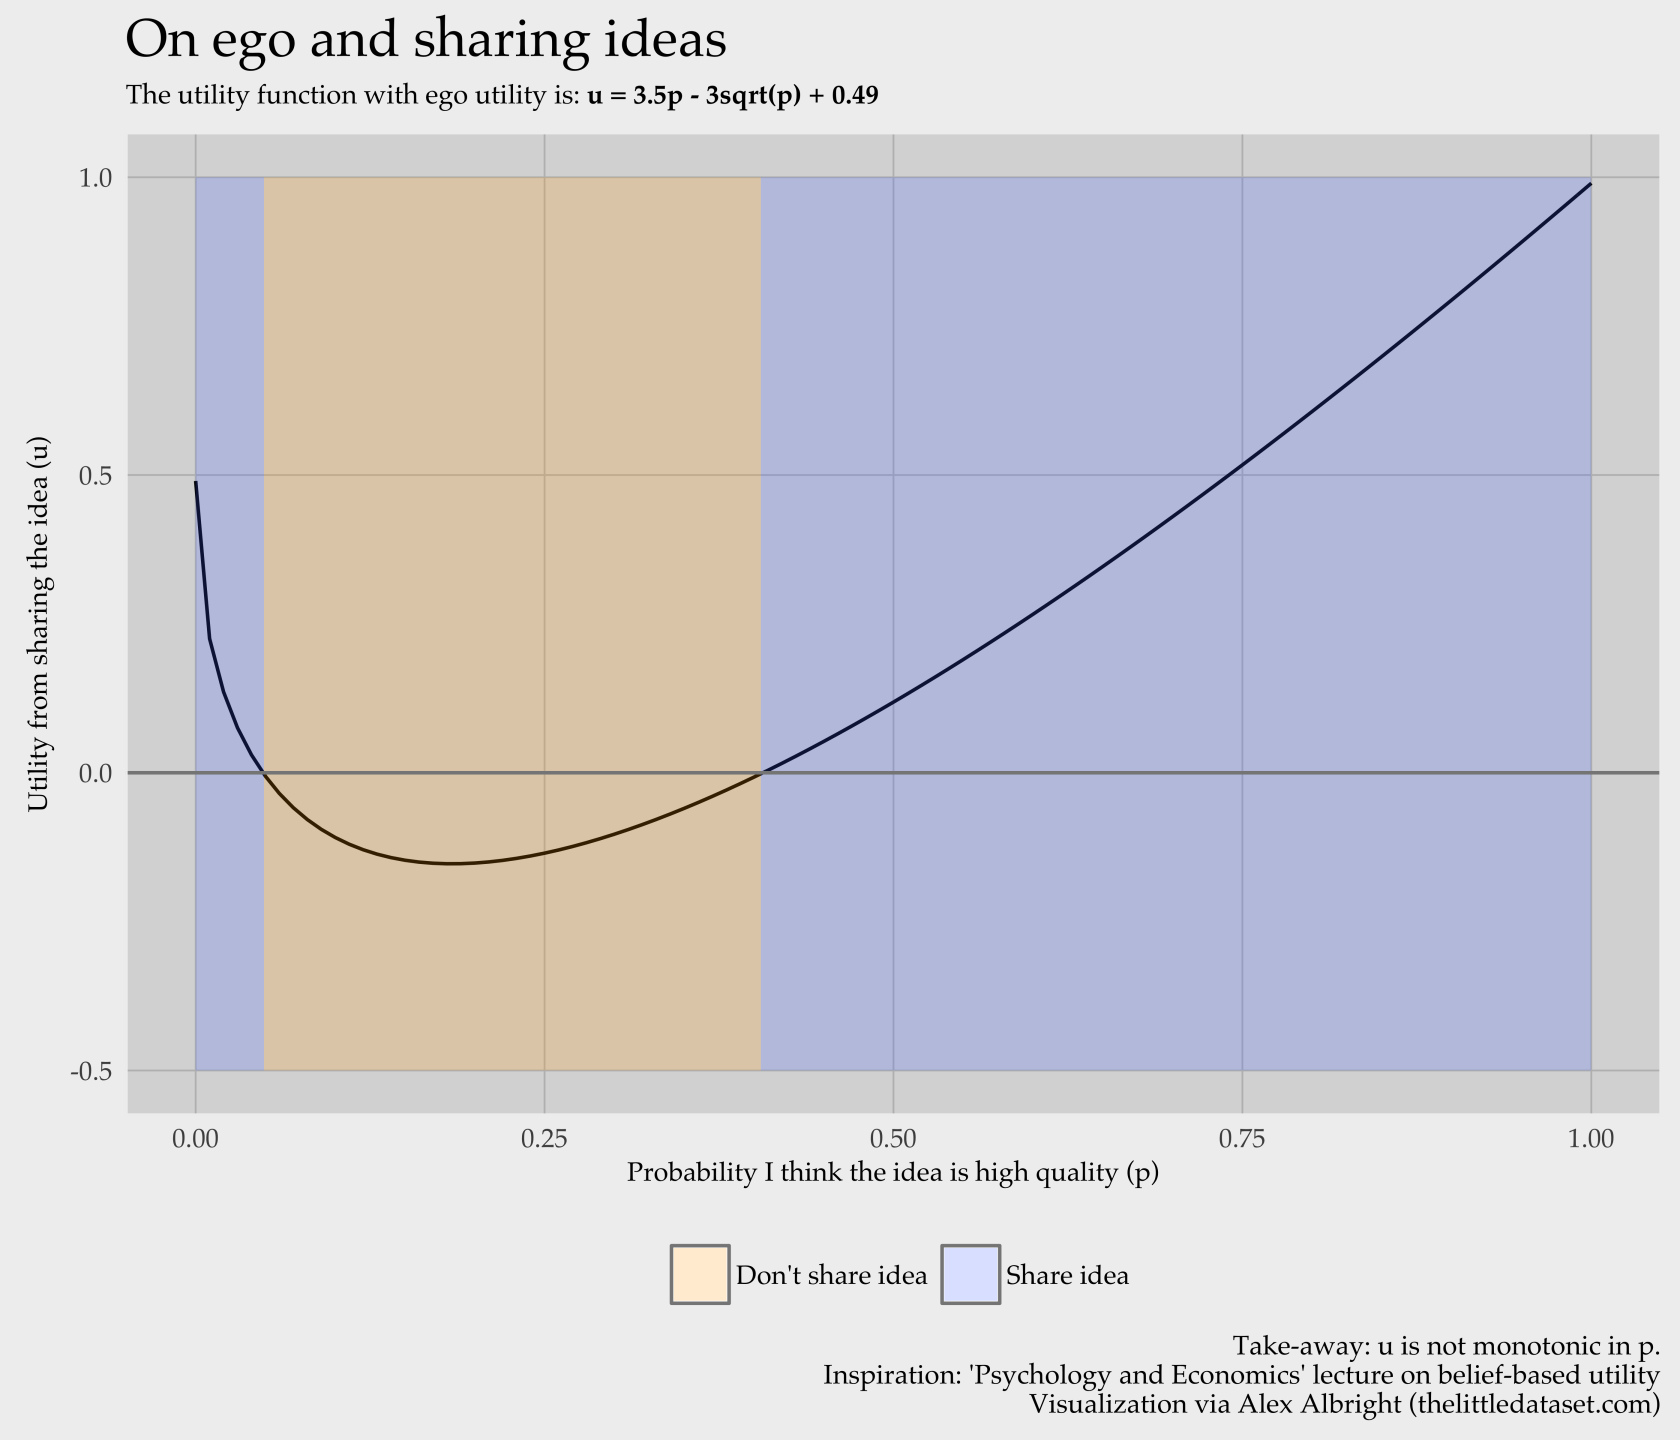
The graph I built depicting when to share an idea à la Koszegi is another example of visualizing how model parameters relate to outcomes. ↩︎
-
Note the model assumes no group differences in cost function or ability distributions. ↩︎
-
Any ability above that, the person becomes skilled. Any ability below that, the person does not. ↩︎