Intro
During this past/last week of the podcast Serial, Sarah Koenig explains (unsurprisingly) that throughout her journalistic investigation of the murder of Hae Min Lee she has changed her opinion many times about Adnan’s guilt or innocence:
Several times, I have landed on a decision, I’ve made up my mind and stayed there, with relief and then inevitably, I learn something I didn’t know before and I’m up ended. Sometimes the reversal takes a few weeks, sometimes it happens within hours. And what’s been astonishing to me is how the back and forth hasn’t let up, after all of this time. Even into this very week and I kid you not, into this very day that I’m writing this.
Given the transparent method by which Koenig has shared large chunks as well as scraps of information pertaining to the case week by week, we, the listeners, have similarly been able to shift our opinions/beliefs/doubts about Adnan’s guilt as time has passed. Unlike in the case of a conventional television crime drama, there is no formulaic ending – no revealing of a killer who had been hiding in plain sight the during the entire 40-something minutes of predictively-paced intrigue. Uncertainty – not Adnan, Hae, or Jay – is the key player whose perpetual presence defines our experience with Serial. And given the overarching, dominant role that uncertainty has played in the “Serial phenomenon,” I wondered, after finishing the final episode, how opinions had been shifting over the course of the podcast… Was this uncertainty – the uncertainty that I had heard in coworkers’ debates, read about in think pieces, and fought to accept in the cluttered, MailChimp-ad-filled corners of my mind – evident in the numbers somewhere?
The podcast is weekly, meaning there is time between each episode’s release to ponder, debate, maybe even cast a vote on your opinions…? In fact, yes, there is aggregate-level data with respect to public opinion on Adnan’s guilt (what is the percentage of people that think Adnan is guilty? innocent? what percentage is undecided?) thanks to the dedicated Serial coverage by /r/serialpodcast (note for the less media savvy, more mentally healthy among us: /r/serialpodcast is a subreddit, a page on Reddit, dedicated to discussion of the podcast). After the release of episode 6, users on the sub started creating weekly polls in order to keep track of listeners’ wavering opinions. Every Thursday, starting with October 30th (the date of release for episode 6), a poll was accessible on Reddit. People would vote on the poll until the next week when the poll would close just before the next episode became available. The poll opening and closing times ensured that no information from later episodes $ e \in \{X+z | z \in \mathbb{Z}^+\}$ would influence listeners’ opinions for a given poll meant to illustrate opinions’ in the aftermath of episode $X$. Thus, percentages from the polls accurately reflect where listeners stand after a given episode’s recent reveals!
Going a step further, one could argue that since the voter base for these polls (/r/serialpodcast subscribers) are loyal repeat voters, the percentages associated with each subsequent episode less the corresponding percentages from the previous episode illustrate the differential effect of that very episode. This seems like a logical conclusion since listeners are adjusting their evolving opinions based on new information in the most recent podcast. Therefore, by looking into the changes in aggregate opinion between the airing of episodes 7-12 (we don’t know how episode 6 changed the public’s opinion since we don’t have data before that episode’s release), we can see the effect that episodes 7-12 had on the crowd’s collective opinion.
Less talk, more graphs
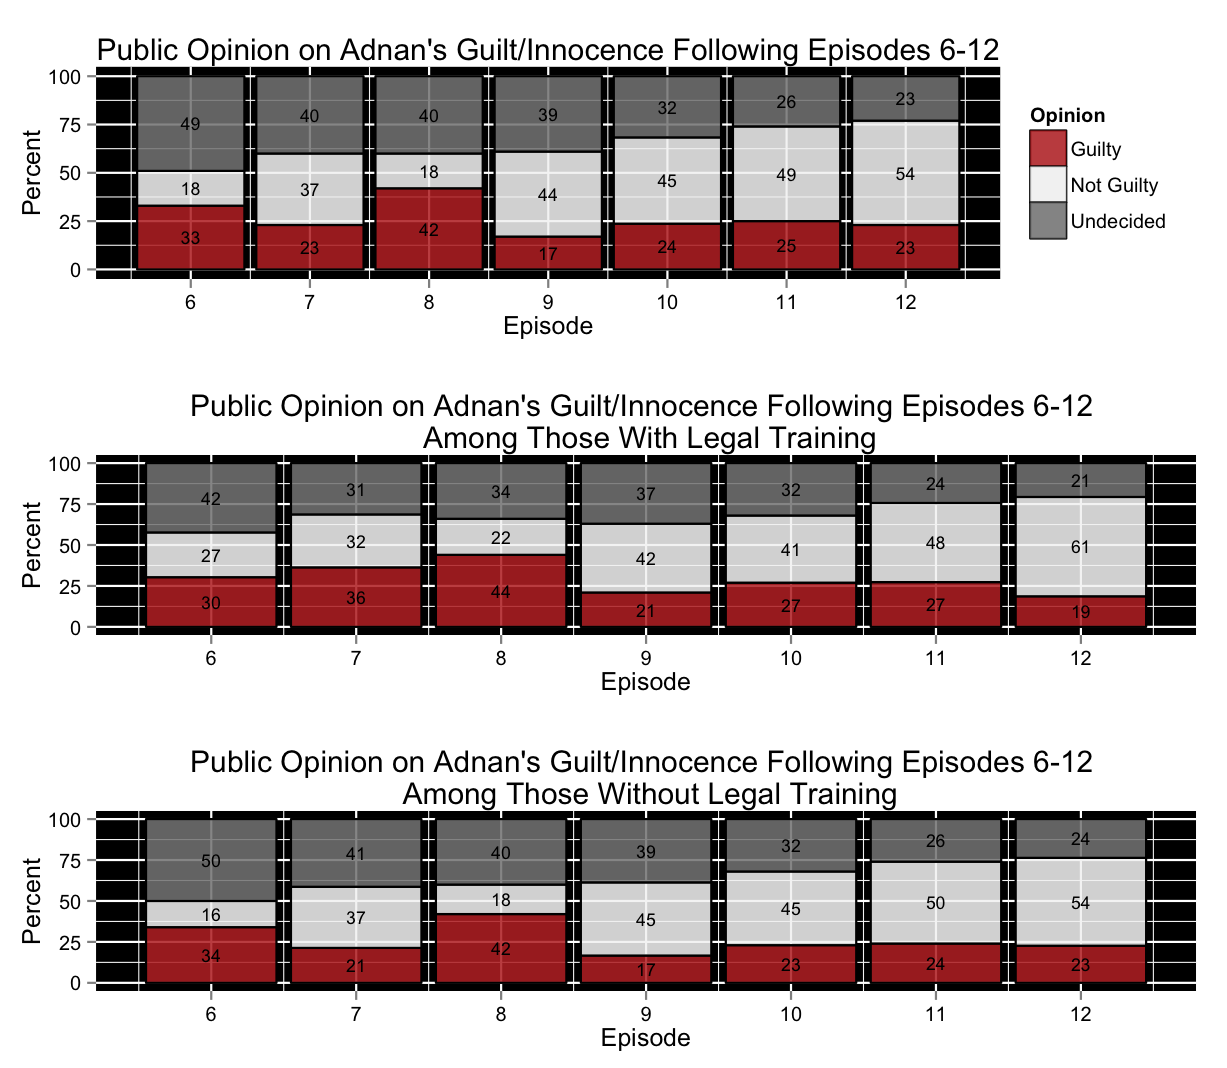
In order to visualize the impact of this range of episodes, I graphed public opinion on Adnan’s guilt following the release of episodes 6-12:

There are many interesting things to note about this progression. First off, the percentage of individuals who believe Adnan is innocent ends on a high note after the finale, What We Know, of the podcast – 54% of voters believe Adnan is innocent. This percentage is exactly three times (!) that following the release of episode 8, The Deal With Jay. Furthermore, it is clear that after Episode 9, To Be Suspected, there are no more aggressive changes to public opinion. Instead, all three stances seem to move steadily – very steadily when compared to the changes brought about in consequence to the release of episodes 7-9.
Turning to episodes 7-9, are the movements in opinion due to said episodes logical given the episodes’ substance? I believe so. Listeners are also potentially mimicking, without realizing it, Koenig’s own state of mind in the episodes. Episode 7, The Opposite of the Prosecution, causes a dip in the guilty percentage (of 10 percentage points) and a jump in the not guilty percentage (of 19 percentage points) – a consequence that is predictable just given the name of the episode. However, episode 8 undoes all the hard work episode 7 did for Adnan’s case in the eyes of the public. The not guilty percentage drops down to post episode 6 levels at 18%, while the guilty percentage is above post episode 6 levels at 42%. The largest of all the weekly changes of heart comes with the release of episode 9, To Be Suspected, which highlights Adnan’s calm demeanor during his time in prison. The guilty camp goes from containing 42% of the voters to just 17% while the not guilty camp goes from 18% to 44%. In the graph, this change almost creates a perfectly symmetrical “X” with the guilty and not guilty lines. It is also in this episode that Adnan also makes an emotional appeal to Koenig saying that that his parents would be happier if they thought he deserved to be in prison – therefore saying that if he were lying about his innocence he would be bringing pain to his parents – something that Adnan, the same person with the funny anecdote about T-mobile customer service behind bars, wouldn’t do.
Another interesting element to note in this analysis is that, over our available time period, the percentage of people who vote as undecided has declined or remained the same every week. This potentially illustrates that despite the fact that more and more scraps, facts, and individuals were added into the mix throughout the progression of the postcast, the aggregate group of voters did feel more certain in their convictions – to the point of no longer checking the “undecided” option. However, this result could also be a fragment of something I felt myself when answering the poll near the end of the podcast – I wanted to vote one way or the other because I felt increasingly useless to the polling exercise by voting undecided repeatedly. Perhaps with the end of the podcast nearing, individuals wanted to be able to make a decision and stick to it, regardless of the constant insecurity in their beliefs.
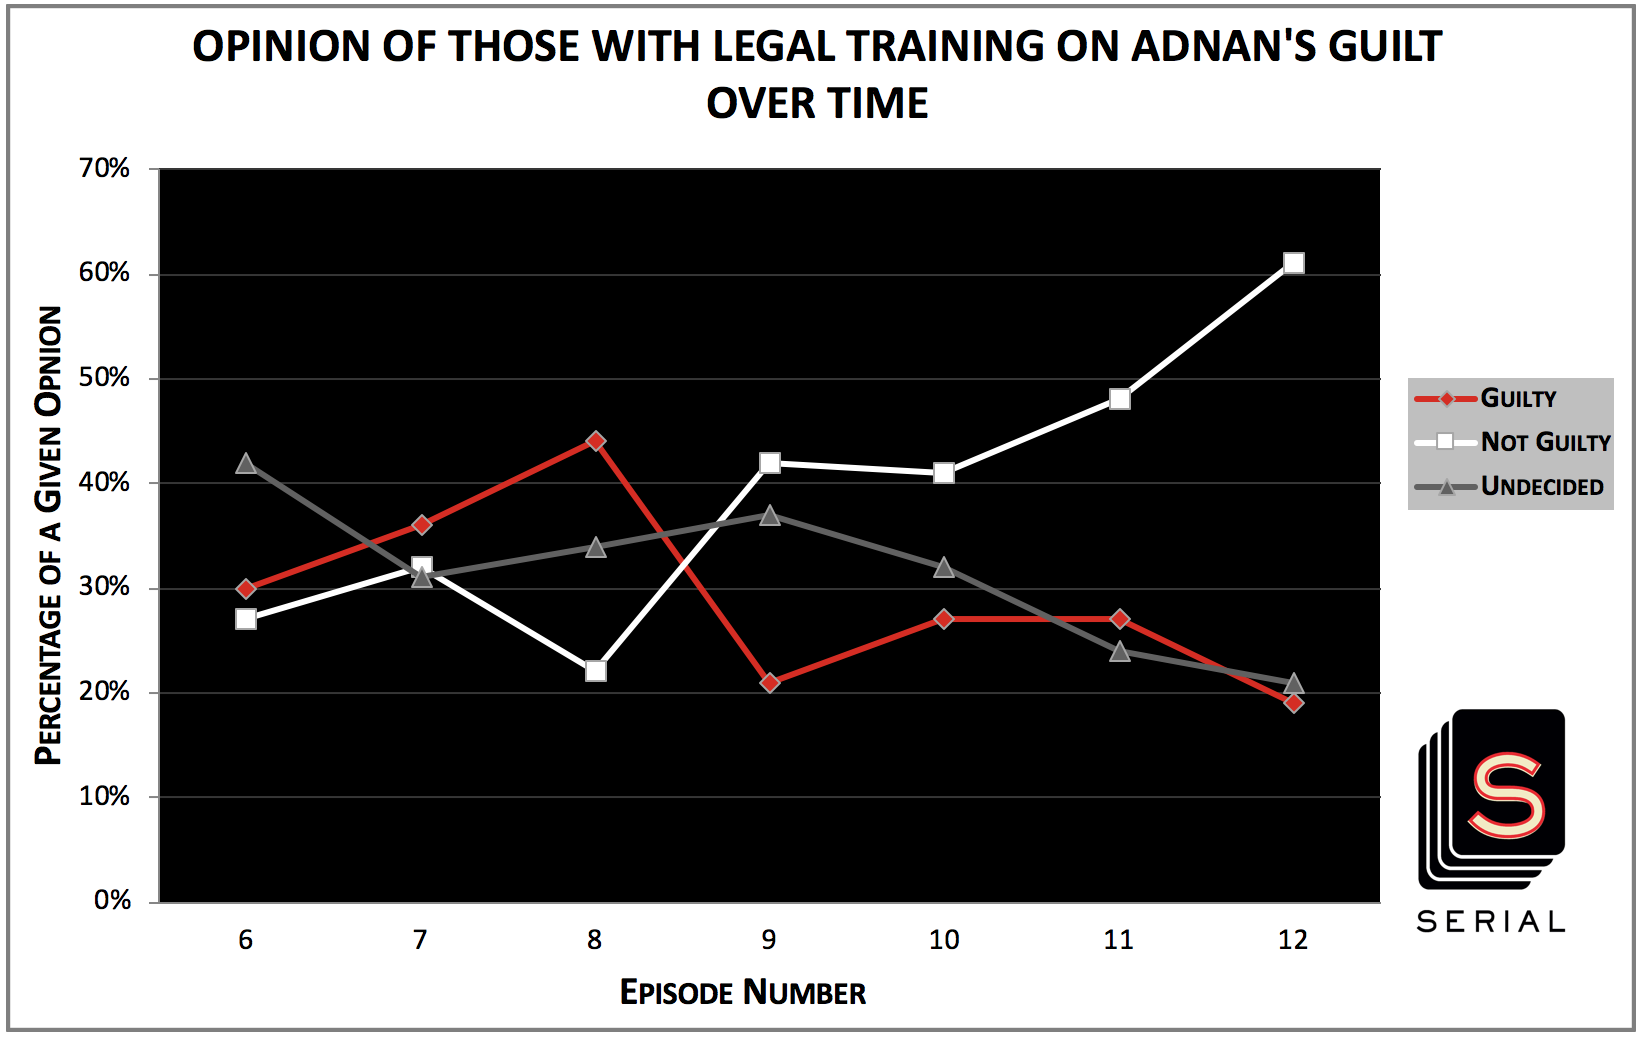
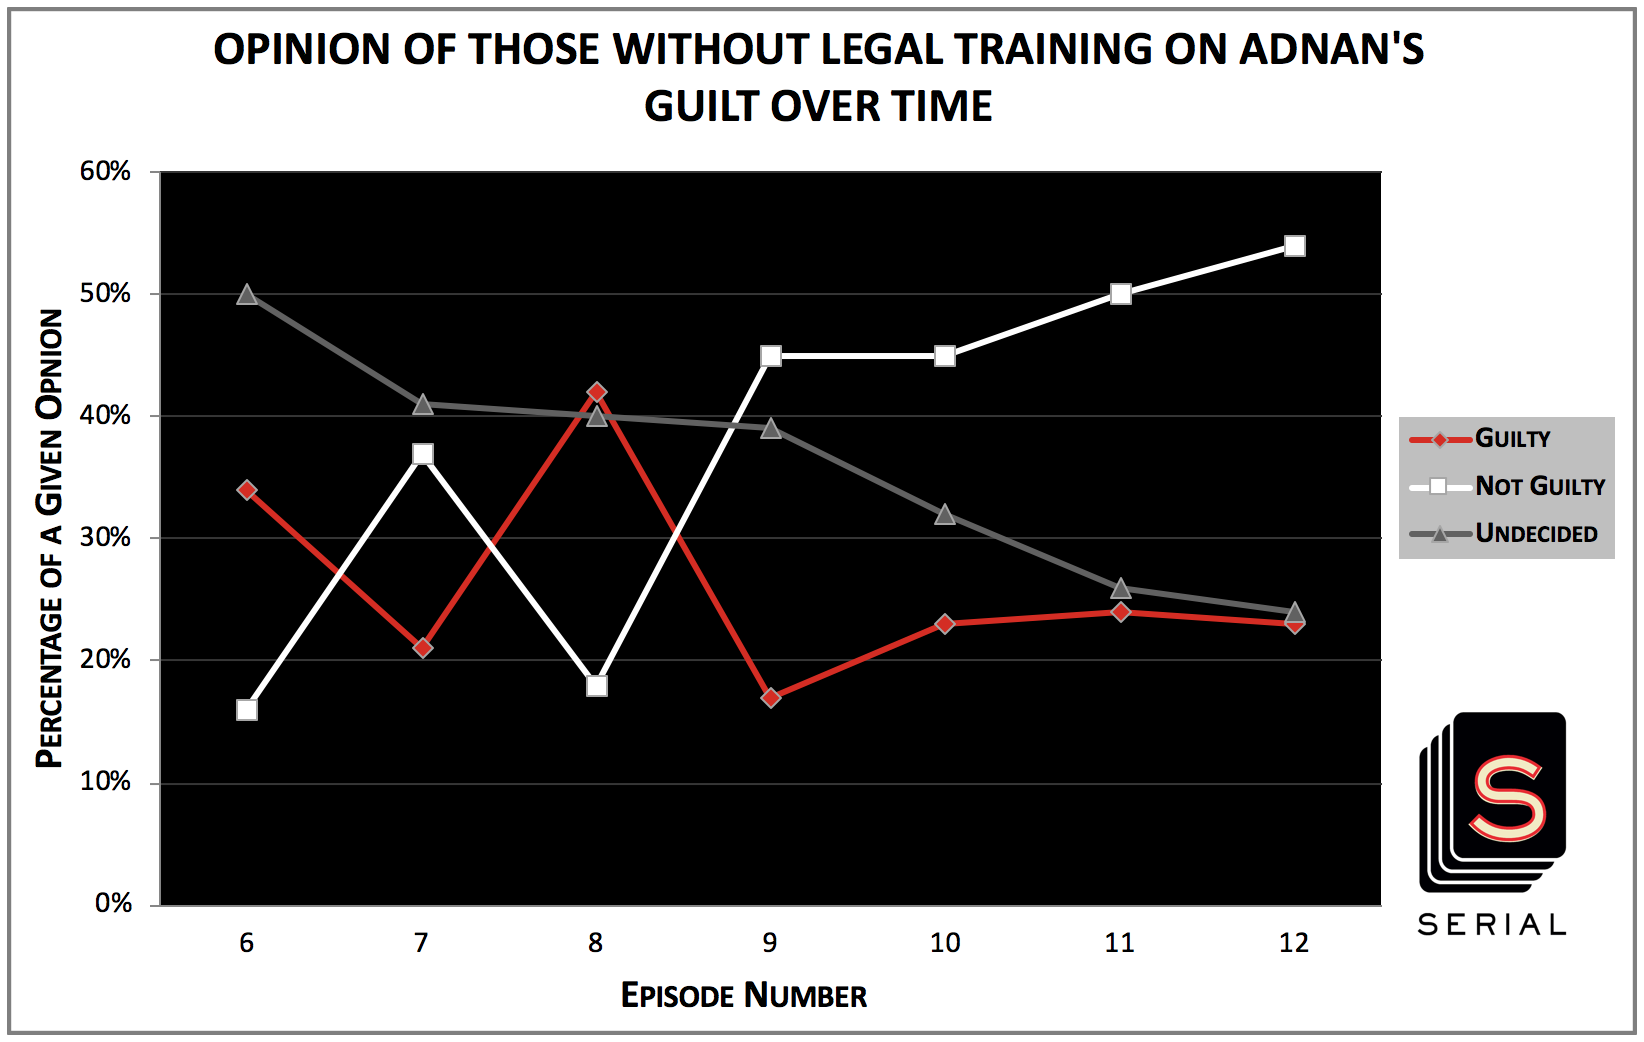
After looking into how each episode affected aggregate opinions, I wondered if this could differ between the subgroups that reddit users included in their polls – specifically, those with legal training and those without legal training.


It is immediately evident that the percentages in these two graphs are very similar once episode 8 has aired. However, there is a large and obvious difference in how the two groups respond to episode 7, The Opposite of the Prosecution. For those without legal training, it bumped up the numbers for not guilty by 21 percentage points and pushed down the numbers for guilty by 13 percentage points…but, for those with legal training, it bumped up the numbers for not guilty by just 5 percentage points and even pushed up the numbers for guilty by 6 percentage points.
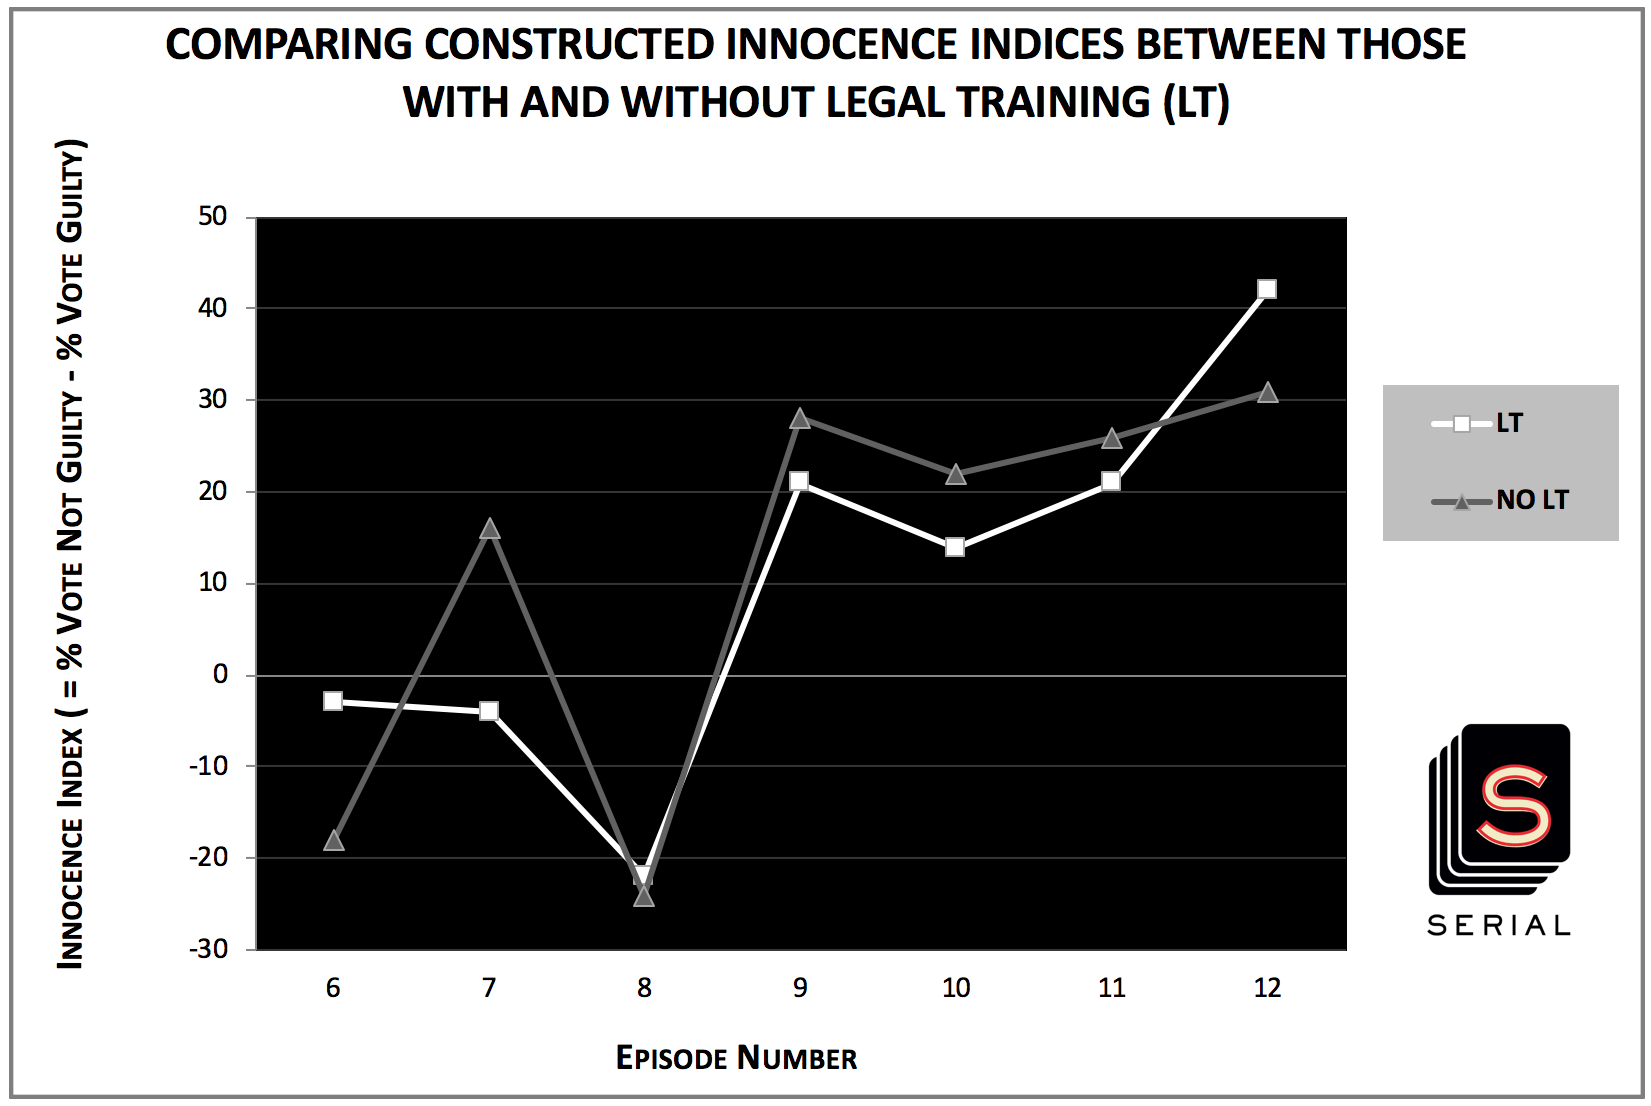
An easier way to visualize and understand the differences between the two divergent responses to episode 7 is by ignoring the undecided percentages in order to create a “innocence index” of sorts. This quasi-index is equal to the percentage of voters who vote that Adnan is not guilty minus the percentage of voters who vote that Adnan is guilty. The index doesn’t have any meaning other than the differential between perceived innocence and perceived guilt according to the crowd of voters.

Since we don’t have information from before the release of episode 6, we can’t speak to the differential nature of episode 6 (it could have been that the two groups were divergent in a similar way before that episode and, therefore, episode 6 had little or no effect on aggregate opinion), however, in the case of episodes 7-12, it is very clear that the paths of the two subgroups are extremely similar except for in the aftermath of episode 7. For those with legal training, the innocence index doesn’t move substantially, it actually goes down one point, meanwhile the index increases by 34 points for those without legal training.
Perhaps this drastically different response is because of the fact that episodes 6 and 7 deal with the case against and the case for the innocence of Adnan. It could be that those with legal training are aware of the potential brutal nature of the case that could be made against Adnan as well as the potentially very favorable nature of the direct opposite approach. Perhaps these individuals are not surprised by the way episode 7 threw off much of the doubt cast on him by episode 6 because they are familiar with the legal process, and understand how a single case can be framed in extremely different ways. Meanwhile, the opinions of those of us more in the dark when it comes to the dynamics of a prosecution/defense were more malleable. Regardless of the exact reasons for this divergence, the difference in the two groups’ innocence indices following episode 7 is immediately striking.
In short
I have doubted myself with respect to my thoughts on Adnan’s case over the past many weeks. I’ve oscillated up and down with the severity of the rises and falls in the included figures. In brief, it is incredible to see that the week of Serial you just consumed can so profoundly alter the core of your beliefs about the case.
You don’t need Sarah Koenig to serenade you during the finale with tales of the tenuous nature of truth in order to have the point driven home that we are often unsure, uncertain, unclear about our convictions… Just look at the pretty pictures.
Or just listen to that girl pronounce Mail Chimp. Is it Kimp or Chimp? We may never know.
Update: New Visuals [March 2015]
My original approach in visualizing this data used line charts, which I think are often the best option for depicting time-series data (due to their simplicity and corresponding comprehensibility). However, using line charts in this context generates lines out of what are truly discrete points–in other words, the plot assumes a linear trend in opinion changes between episodes, which does not reflect the true nature of the data. Because of this conceptual shortcoming that accompanies line charts, I decided to try out another form of visualization that could more accurately represent the discrete nature of the data points. Thanks to a great FlowingData post, I realized an interesting way to do this would be to use stacked bar charts since all the percentages for each opinion of guilty, no guilty, or undecided add up to 100%. (Originally I was attracted to the stacked area chart because it seems sexier–or, as sexy as a chart can be–however, this method also fails to accurately depict the discrete nature of the data points! So, stacked bar chart it is.) Here is the result (made with the ggplot2 package in R)1:

Data/Code
Here are the poll percentage sources in case anyone is curious: Percentages for episodes 6-8, Percentages for episodes 9-11, and Percentages for episodes 12 – I collected the data for episode 12 at 6:30pm EST Thursday 12/18/14. I looked at the updated information at 12:50am EST 12/19/14 and, of course, more people had voted, but the percentages for guilty/innocent/undecided were the same. So, I use these numbers without fear of dramatic change in the next few days.
All data and scripts used for this project are available in my “Serial” Github repo.
-
Percentages are rounded to the nearest percentage point. Therefore, some combinations might add up to 101 or 99 instead of 100 due to rounding in each category. ↩︎