Intro
I was born on November 13th, 1992. And, while that might be sufficient information to verify my identity to that pre-recorded human on the other end of my calls to the bank, there is an important detail always excluded in this formal expression of one’s birth date: the day of the week. And what makes this seemingly unremarkable fact about me exciting (or disturbing, depending on your take) is that pesky, frequently ignored detail. I was born on a Friday.
Yes, Friday the 13th, the universally proclaimed day of bad luck. Black cats, the devil, all that jazz. Despite the fact that it was the strong but random force of chance, not some meaningful destiny, that sealed my birth date, I still feel a personal tie to the dark and twisty combination. And, given this past February’s Friday the 13th immediately followed by another, today(!), in March, I decided to revisit an old question: how frequent is Friday the 13th anyway? And how often does this February-March combination happen? Are there other regular month combinations?
1985-2015
In response to the former, in the long run, Friday is actually the day of the week mostly likely to fall on the 13th! Just by a tiny bit…the probability of a Friday being on the 13th is 0.1433 while the probabilities of other days falling on the 13th are 0.1425 (Thursday & Saturday), 0.1427 (Monday & Tuesday), and 0.1431 (Wednesday & Sunday).1 Over the past thirty years, the average number of Friday the 13th’s in a year was approximately 1.74. This is slightly higher than expected if one assumed there was exactly a $\frac{1}{7}$th chance of a Friday the 13th every month of every year, as $\frac{1}{7} \times 12=1.714$.
See below for a visualization of Friday the 13th (F13 from now on) frequencies over the past three decades:

It is obvious from this graph that each of the past thirty years contain at least one F13. This is because it is actually impossible to have a year without any F13’s. In fact, this fact is pretty quickly mathematically proven. (See proof here!)
Month combinations
The distribution of F13’s over different months is very evenly aggregated over the past thirty years; six months contained a F13 four times, while the other six months contained one five times. However, all months are not equally likely to share a F13 in the same year with all other months. For instance, in the past thirty years, March and November both had F13’s in five of the same years, while March and May never had a F13 in the same year. One can verify this claim that certain month combinations are more frequent that others by inspecting the following heat map visualization:
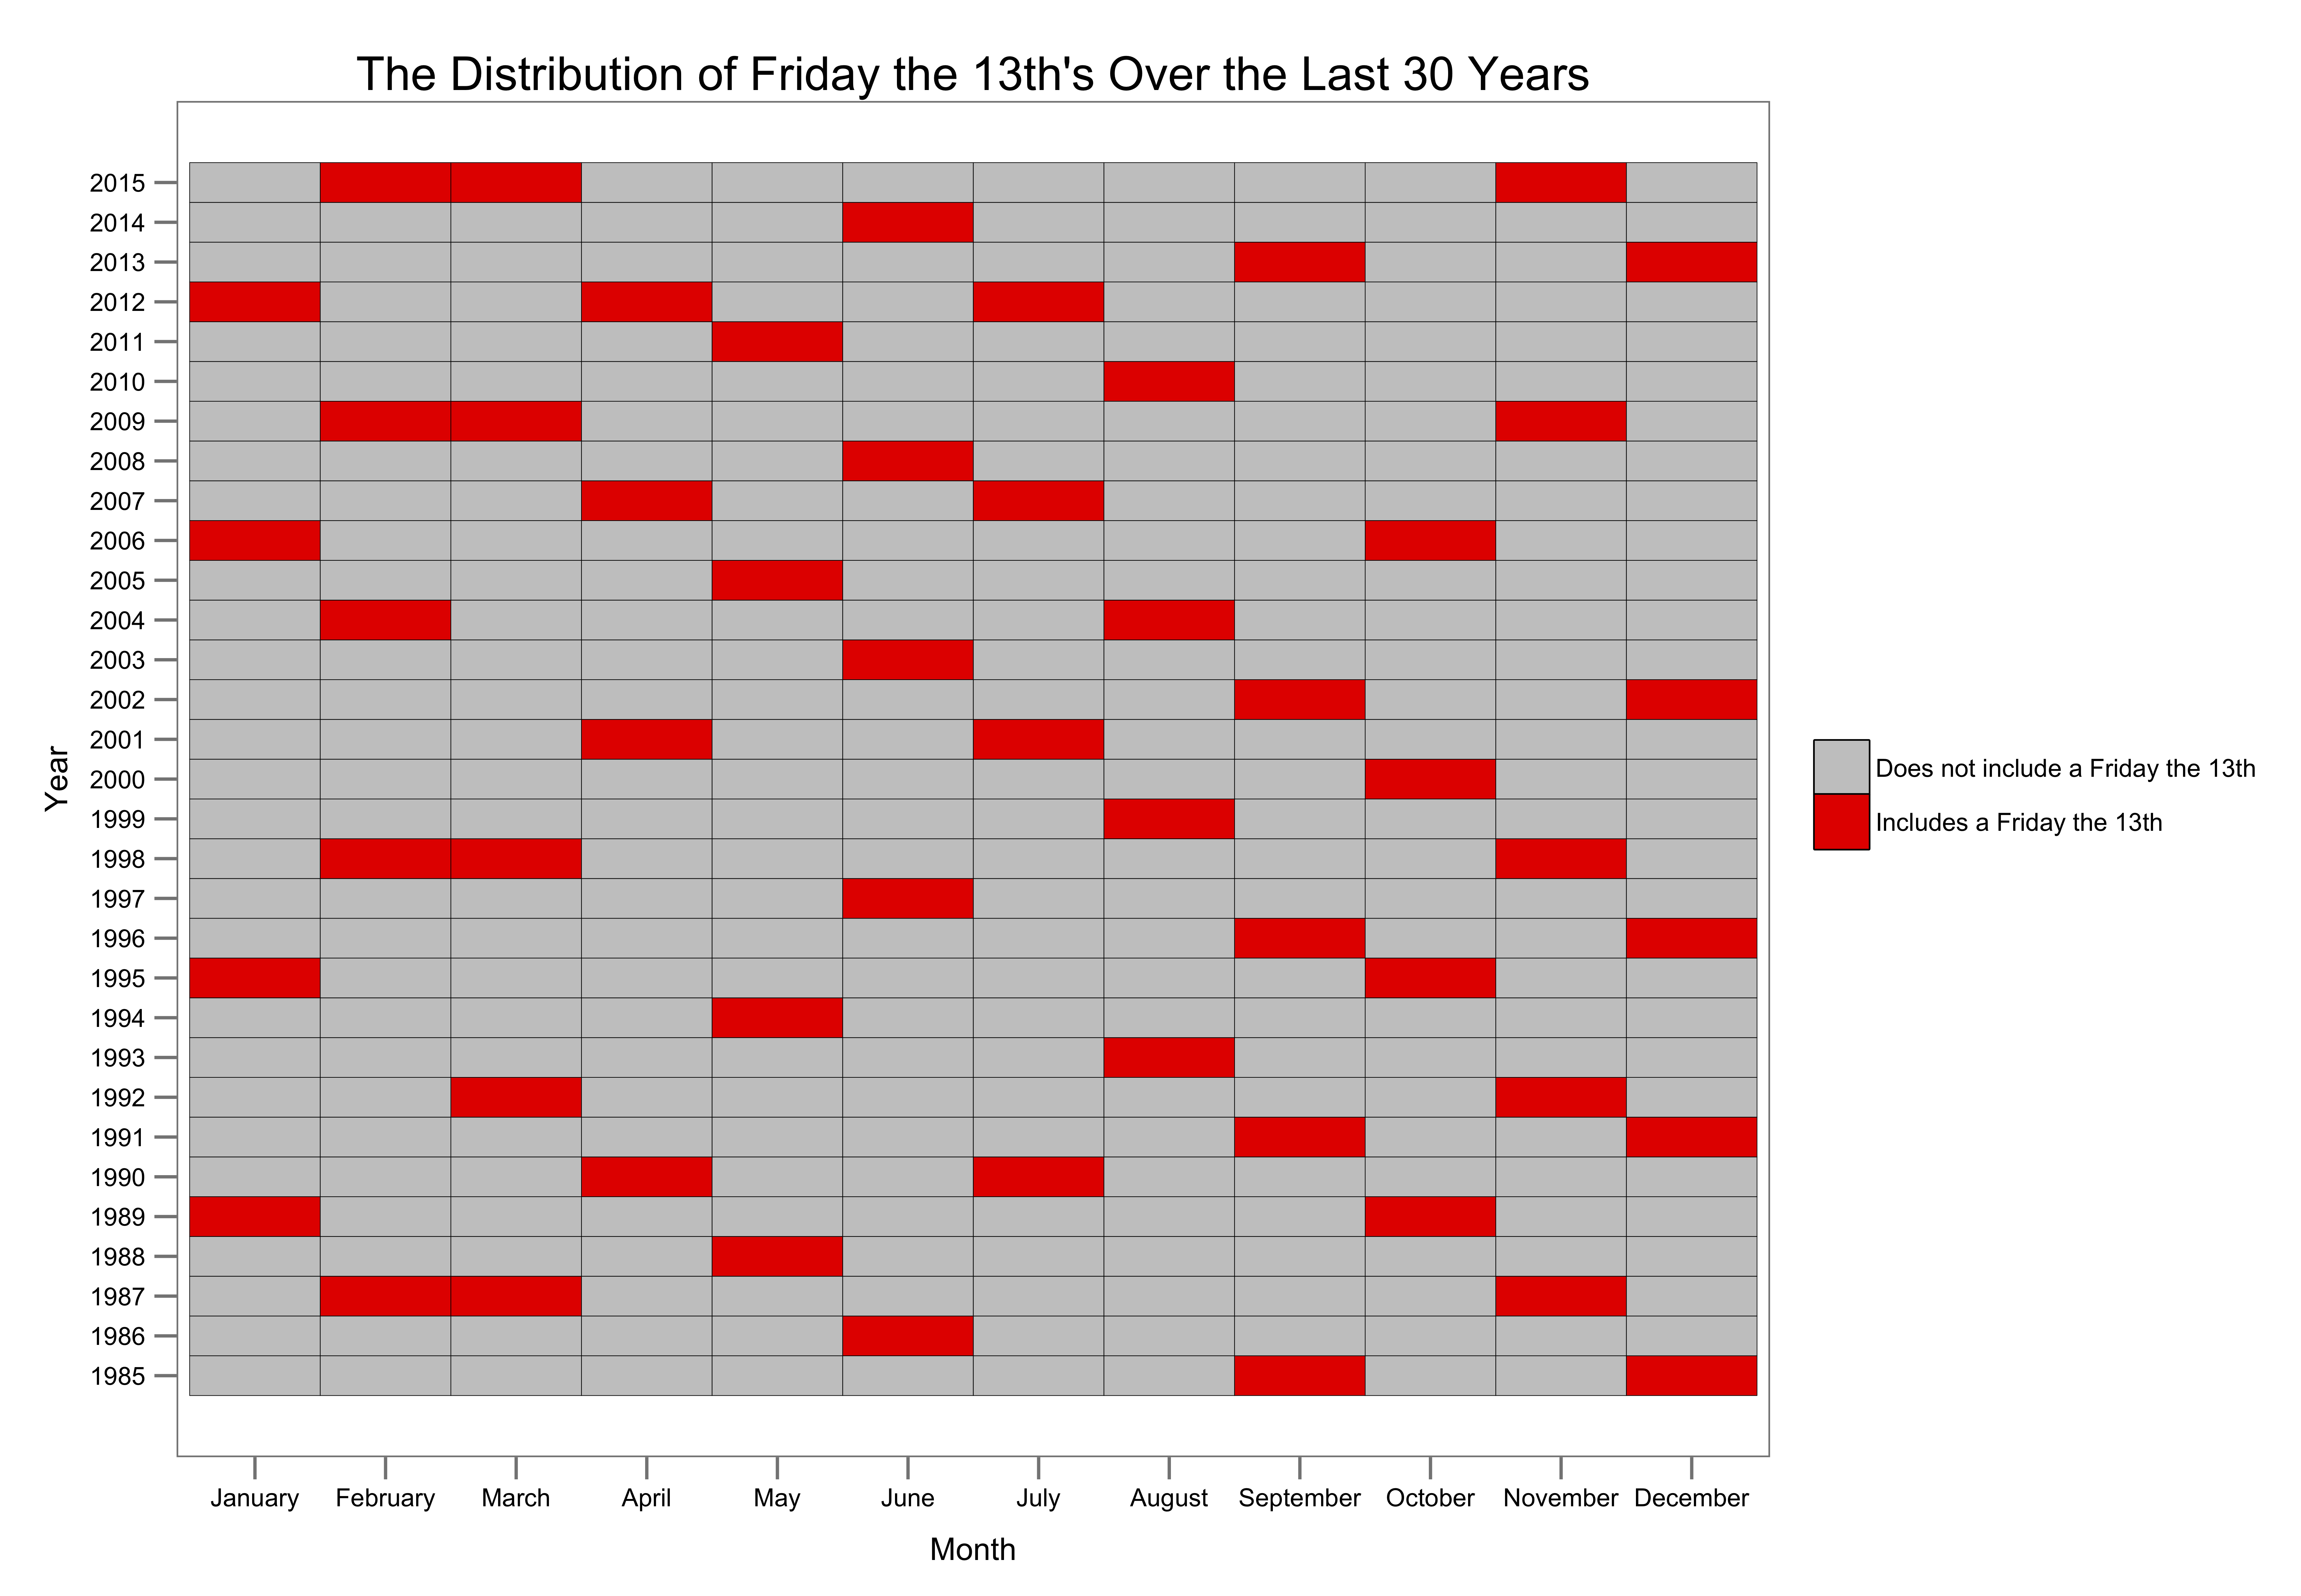
Most evident in the above plot is the February-March-November combination–immediately noticeable since February and March are right next to one another. It turns out that our current year, 2015, is one of five in the past thirty with three F13’s, and also one of four years (1987, 1998, 2009, 2015) in the past thirty featuring the February-March-November combination.
While the February-March-November combination is the most frequent trio in the past thirty years (the only other one being January-April-July in 2012), there are duos that are just as frequent during this time period. In order to best see the all the combinations of months that have had F13’s in the same year, I created a network visualization. This network features an bi-directional edge between two months (represented by red vertices) if they have both had a F13 in the same year. Alternatively, a vertex can also have a loop (an edge that connects it to itself) if it was the only month in a year to feature a F13.
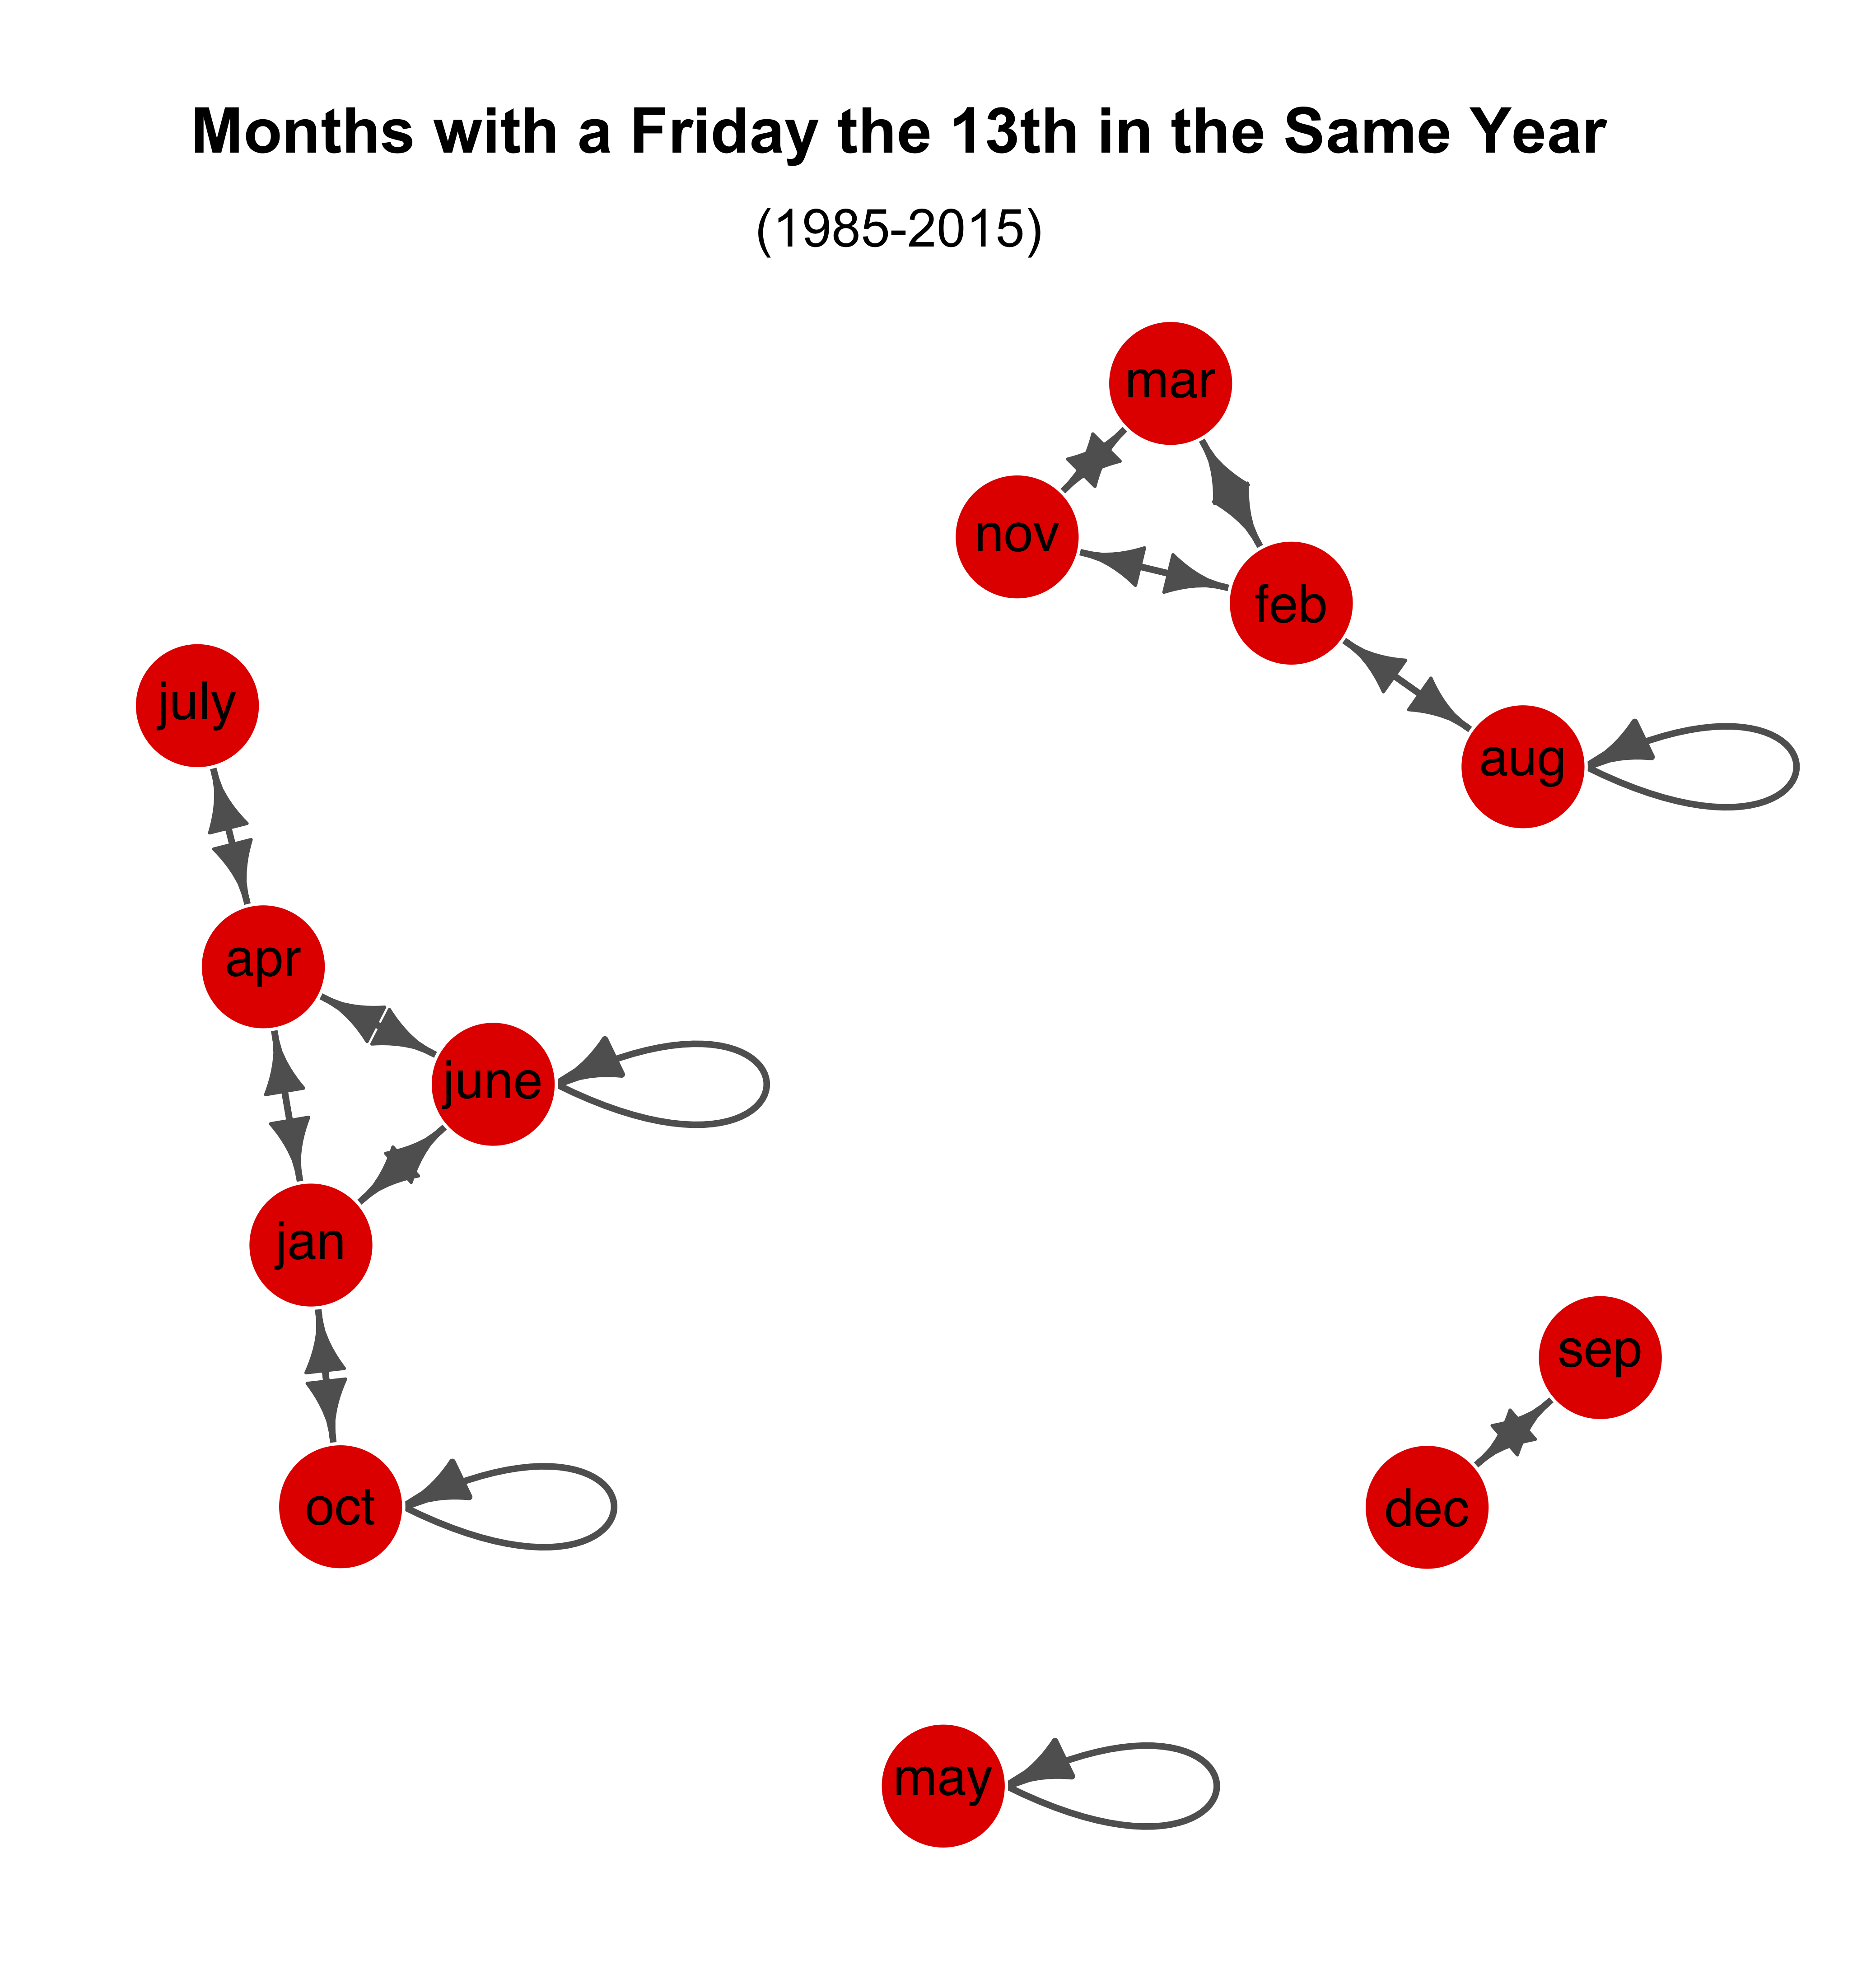
This network breaks down into four smaller graphs of sizes 1, 1, 5, and 7 (size in a graph is defined as the number of edges).2 From this network, one can see clearly that May is the only month in the past thirty years to have never shared a F13 with another month in the same year. Also, over this time periods, September had a F13 if and only if December did as well. Lastly, January, February, and April are the months that have shared a F13s with the most other months.
Despite the fact that there is nothing mathematically extraordinary about occurrences of November Friday the 13th’s, I still hold tight to my personal connection to the date. While November Friday the 13th is not incredibly rare, it did turn out that 1992 was the only year in the past thirty to have a November Friday the 13th without both February and March Friday the 13th’s preceding it. (See the heat map!) And if that’s a fact I can use to infuse some sort of mathematical significance into my birthday then I am using it. After all, it is this very date that has given me an affinity for a number usually considered substandard as well as the birthright to scoff, personally offended, when an apartment building elevator disrespectfully skips from the 12th to the 14th floor.
Code
All data and R scriptsneeded to recreate these visualizations are available on my “Fri13” Github repo.
Future work
- Add weights to edges to depict frequencies of various month combinations
- Use network centrality methods paired with edge weights to determine the months that are the most central3
-
There are no weights for the edges in this network. Instead, an edge between two vertices,
$a$and$b$, is determined by the binary response to: in a given year, have months a and b ever both included a Friday the 13th? If no, no edge exists between$a$and$b$. If yes, an edge exists between a and b. However, one could easily extend this work by weighting the edges to depict frequencies of various month combinations. ↩︎ -
At this moment, using simple degree centrality measures, the most central months would be January, February, and April–with June included if you count loops towards degree measures. ↩︎