Since finishing my first year of my PhD, I have been spending some quality time with my computer. Sure, the two of us had been together all throughout the academic year, but we weren’t doing much together besides pdf-viewing and type-setting. Around spring break, when I discovered you can in fact freeze your computer by having too many exams/section notes/textbooks simultaneously open, I promised my MacBook that over the summer we would try some new things together. (And that I would take out her trash more.) After that promise and a new sticker addition, she put away the rainbow wheel.
Cut to a few weeks ago. I had a blast from the past in the form of a Twitter notification. Someone had written a post about using R to analyze the TV show Friends, which was was motivated by a similar interest that drove me to write something about the show using my own dataset back in 2015. In the post, the author, Giora Simchoni, used R to scrape the scripts for all ten seasons of the show and made all that work publicly available (wheeeeee) for all to peruse. In fact, Giora even used some of the data I shared back in 2015 to look into character centrality.1 In reading about his project, I could practically hear my laptop humming to remind me of its freshly updated R software and my recent tinkering with R notebooks.2 So, off my Mac and I went, equipped with a new workflow, to explore new data about a familiar TV universe.
Who’s Doing The Talking?
Given line by line data on all ten seasons, I, like Giora, first wanted to look at line totals for all characters. In aggregating all non-“friends” characters together, we get the following snapshot:

First off, why yes, I am using the official Friends font. Second, I am impressed by how close the totals are for all characters though hardly surprised that Phoebe has the least lines. Rachel wouldn’t be surprised either…
Rachel: Ugh, it was just a matter of time before someone had to leave the group. I just always assumed Phoebe would be the one to go.
Phoebe: Ehh!!
Rachel: Honey, come on! You live far away! You’re not related. You lift right out.
With these aggregates in hand, I then was curious: how would line allocations look across time? So, for each episode, I calculate the percentage of lines that each character speaks, and present the results with the following three visuals (again, all non-friends go into the “other” category):


Tell me that first graph doesn’t look like a callback to Rachel’s English Trifle. Anyway, regardless of a possible trifle-like appearance, all the visuals illustrate dynamics of an ensemble cast; while there is noise in the time series, the show consistently provides each character with a role to play. However, the last visual does highlight some standouts in the collection of episodes that uncharacteristically highlight or ignore certain characters. In other words, there are episodes in which one member of the cast receives an unusually high or low percentage of the lines in the episode. The three episodes that boast the highest percentages for a single member of the gang are:
- “The One with Christmas in Tulsa” (41.9% Chandler)
- “The One With Joey’s Interview” (40.3% Joey)
- “The One Where Chandler Crosses a Line” (36.3% Chandler).
Similarly, the three with the lowest percentages for one of the six are:
- “The One With The Ring” (1.5% Monica)
- “The One With The Cuffs” (1.6% Ross)
- “The One With The Sonogram At The End” (3.3% Joey)
The sagging red lines of the last visual identify episodes that have a low percentage of lines spoken by a character outside of the friend group. In effect, those dips in the graph point to extremely six-person-centric episodes, such as “The One On The Last Night” (0.4% non-friends dialogue – a single line in this case), “The One Where Chandler Gets Caught” (1.1% non-friends dialogue), and “The One With The Vows” (1.2% non-friends dialogue).
The Men vs. The Women3
Now, how do the line allocations look when broken down by gender lines across the main six characters? Well, the split consistently bounces around 50-50 over the course of the 10 seasons. Again, as was the case across the six main characters, the balanced split of lines is pretty impressive.


Note that the second visual highlights that there are a few episodes that are irregularly man-heavy. The top three are: “The One Where Chandler Crosses A Line” (77.0% guys), “The One With Joey’s Interview” (75.1% guys), and “The One With Mac and C.H.E.E.S.E.” (70.2% guys). There are also exactly two episodes that feature a perfect 50-50 split for lines across gender: “The One Where Rachel Finds Out” and “The One With The Thanksgiving Flashbacks.”
Say My Name
How much do the main six characters address or mention one another? Giora addressed this question in his post, and I build off of his work by including nicknames in the calculations, and using a different genre of visualization. With respect to the nicknames – “Mon”, “Rach”, “Pheebs”, and “Joe” – “Pheebs” is undoubtably the stickiest of the group. Characters say “Pheebs” 370 times, which has a comfortable cushion over the second-place nickname “Mon” (used 73 times). Characters also significantly differ in their usage of each others’ nicknames. For example, while Joey calls Phoebe “Pheebs” 38.3% of the time, Monica calls her by this nickname only 4.6% of the time.4
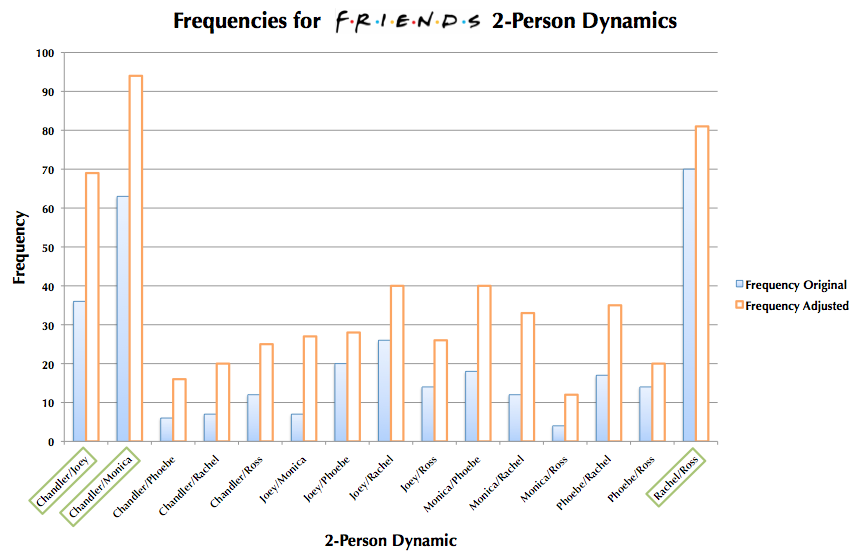
Now, after adding in the nicknames, who says whose name? The following graphic addresses that point of curiosity:

The answer is clear: Rachel says Ross’s name the most! (789 times! OK, we get it, Rachel, you’re in love.) We can also see that Joey is the most self-referential with 242 usages of his own name – perhaps not a shock considering his profession in the entertainment biz. Overall, the above visual provides some data-driven evidence of the closeness between certain characters that is clearly evident in watching the show. Namely, the Joey-Chandler, Monica-Chandler, Ross-Rachel relationships that were evident in my original aggregation of shared plot lines are still at the forefront!
Meta
Comparing the above work to what I had originally put together in January 2015 is a real trip. My original graphics back in 2015 were made entirely in Excel and were as such completely unreproducible, as was the data collection process. The difference between the opaqueness of that process and the transparency of sharing notebook output is super exciting to me… and to my loyal MacBook. Yes, yes, I’ll give you another sticker soon.
Screen fades to black
Executive Producer: Alex Albright
Show Me the Code
Here is the R Notebook for this project. Here is the Github repo.
-
He makes a convincing case using a variety of data sources that Rachel is the most central friend of the six main characters. ↩︎
-
Get ready for new levels of reproducibility! ↩︎
-
If you’re curious about more numbers on the nicknames, check out the project notebook. ↩︎