A Daily Census of Pretrial Inmates
I’ve spent a good amount of time this fall learning about pretrial detention and bail setting practices across the country. While much of the empirical research I’ve encountered on pretrial detention uses either aggregated1 or restricted access data, it turns out that there is a granular pretrial detention dataset that frollicks freely on the internet. As of 7/1/16, Connecticut has published “a daily census of every inmate held in jail while awaiting trial.”2 There are a few incredible aspects of this dataset. For one, it is cleanly organized data for the entire state of Connecticut. Moreover, it is updated daily(!), meaning we can use it to construct a picture of pretrial detention in Connecticut over time that is much more dynamic than what we can expect from national reports.3 As such, I will do two things in this post:
- illustrate a pretrial inmate population drop around Christmas time
- discuss how static daily counts understate the magnitude of jail and pretrial systems
Spotting (Holiday) Seasonality
In annual jail reports, the Bureau of Justice Statistics (BJS) always mentions that “comparisons of year-end data with previous midyear data need to consider seasonal variations, as jails typically hold fewer inmates at year-end than at midyear.” However, to my knowledge, this statement is not further elaborated upon in BJS documents. Why would jails hold fewer people at the end of the year than at the beginning? Well, for one, there is general seasonality in crime itself; the BJS has written reports demonstrating that violent and household property crime “victimization occurred at higher rates during the summer than during other seasons.” Moreover, there could also be trends in bond-related behavior – perhaps people are more likely to be bailed out of jail around Christmas and this shows up in jail numbers. There is anecdoctal support for the claim that Christmas plays a role in reducing jail populations; Dallas County Commissioner Mike Cantrell explains that the jail population “go[es] down every Christmas,” as “[p]eople are getting their loved ones out of jail, or people are not wanting to get in jail, so they stay out.” However, I have not seen any empirical evidence on the relationship between Christmas time and jail populations…
The Connecticut data provides a straight-forward opportunity to address this possible relationship. That is, is Christmas time visible in Connecticut’s pretrial inmate population time series? Could the holiday contribute to the repeated BJS statements on year-end/mid-year counts? (As pretrial inmates account for 65% of the US jail populations,45 pretrial inmates trends should be clearly visible – though distilled – in overall jail population trends as well.)
With these questions in mind, I plot out the daily fluctuations of the pretrial jail population from 7/1/16-1/8/19, marking January 1 of each year with a red line:
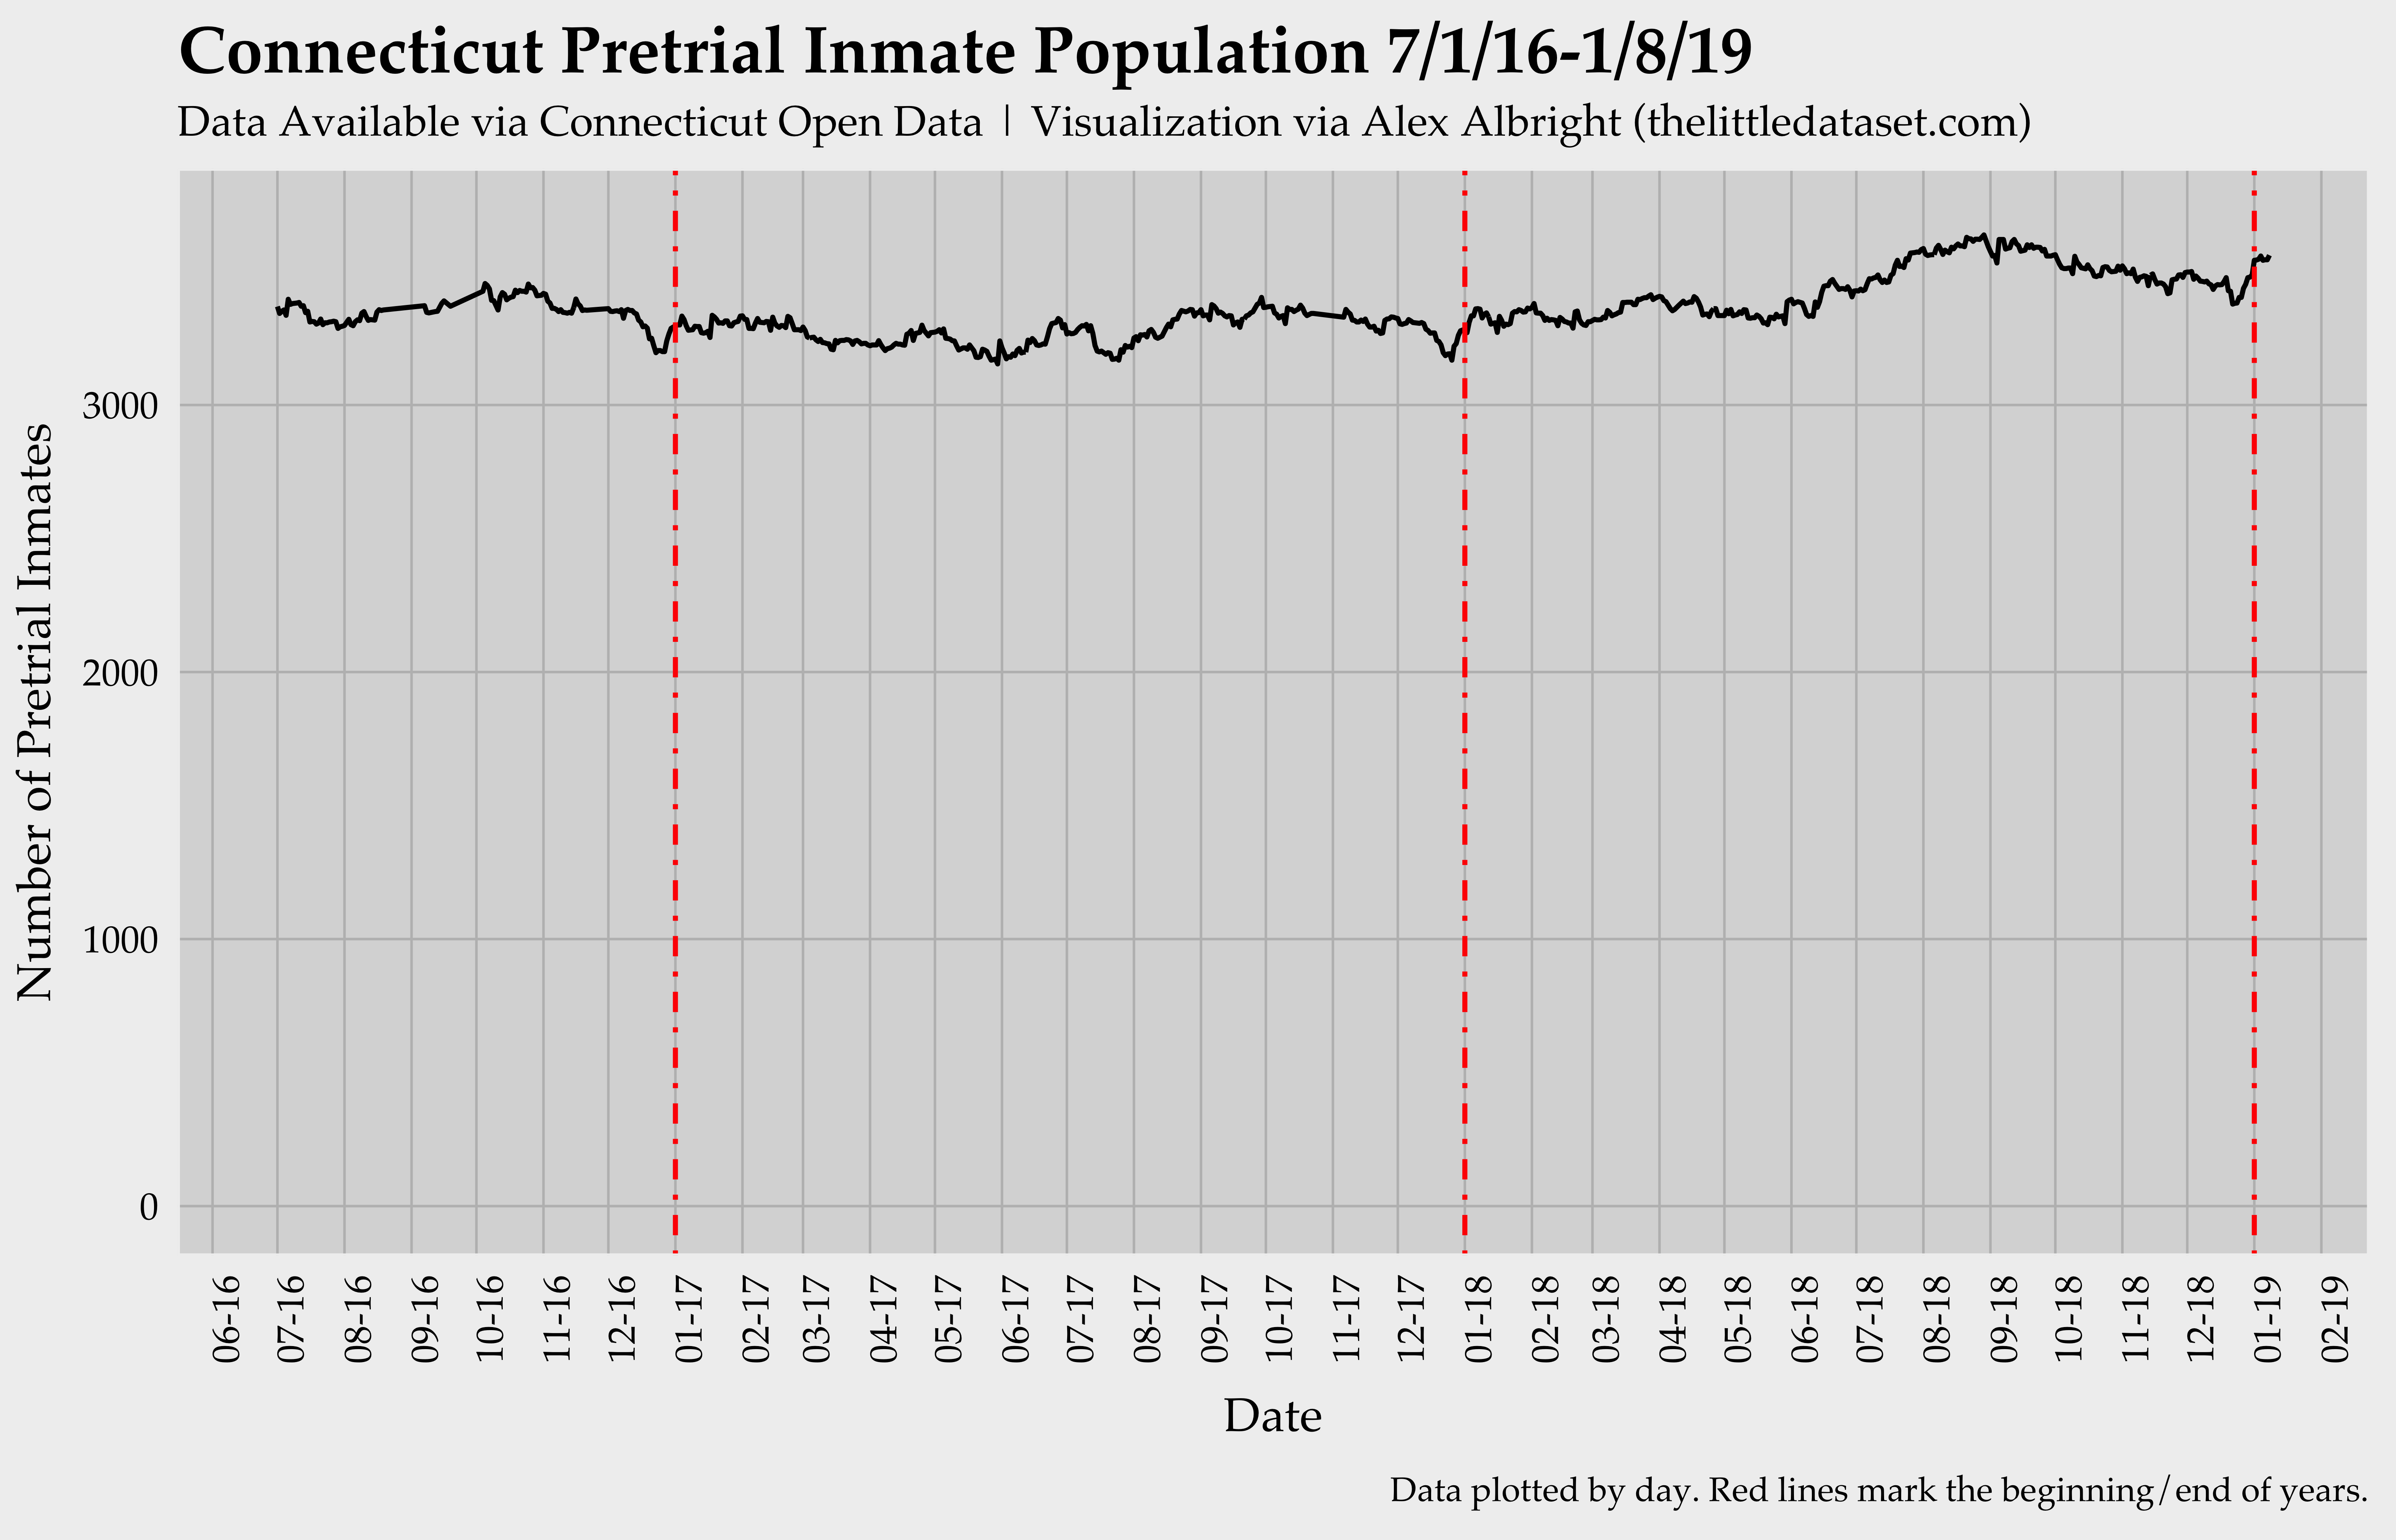
Given a complete (0-max) y-axis, it is hard to spot any variation over time in the population. The pretrial inmate count seems to linger around 3,300 throughout the full 2.5 years. However, if we trunctate the y-axis, there are noticable fluctuations between a low of 3,154 and a high of 3,637 inmates.
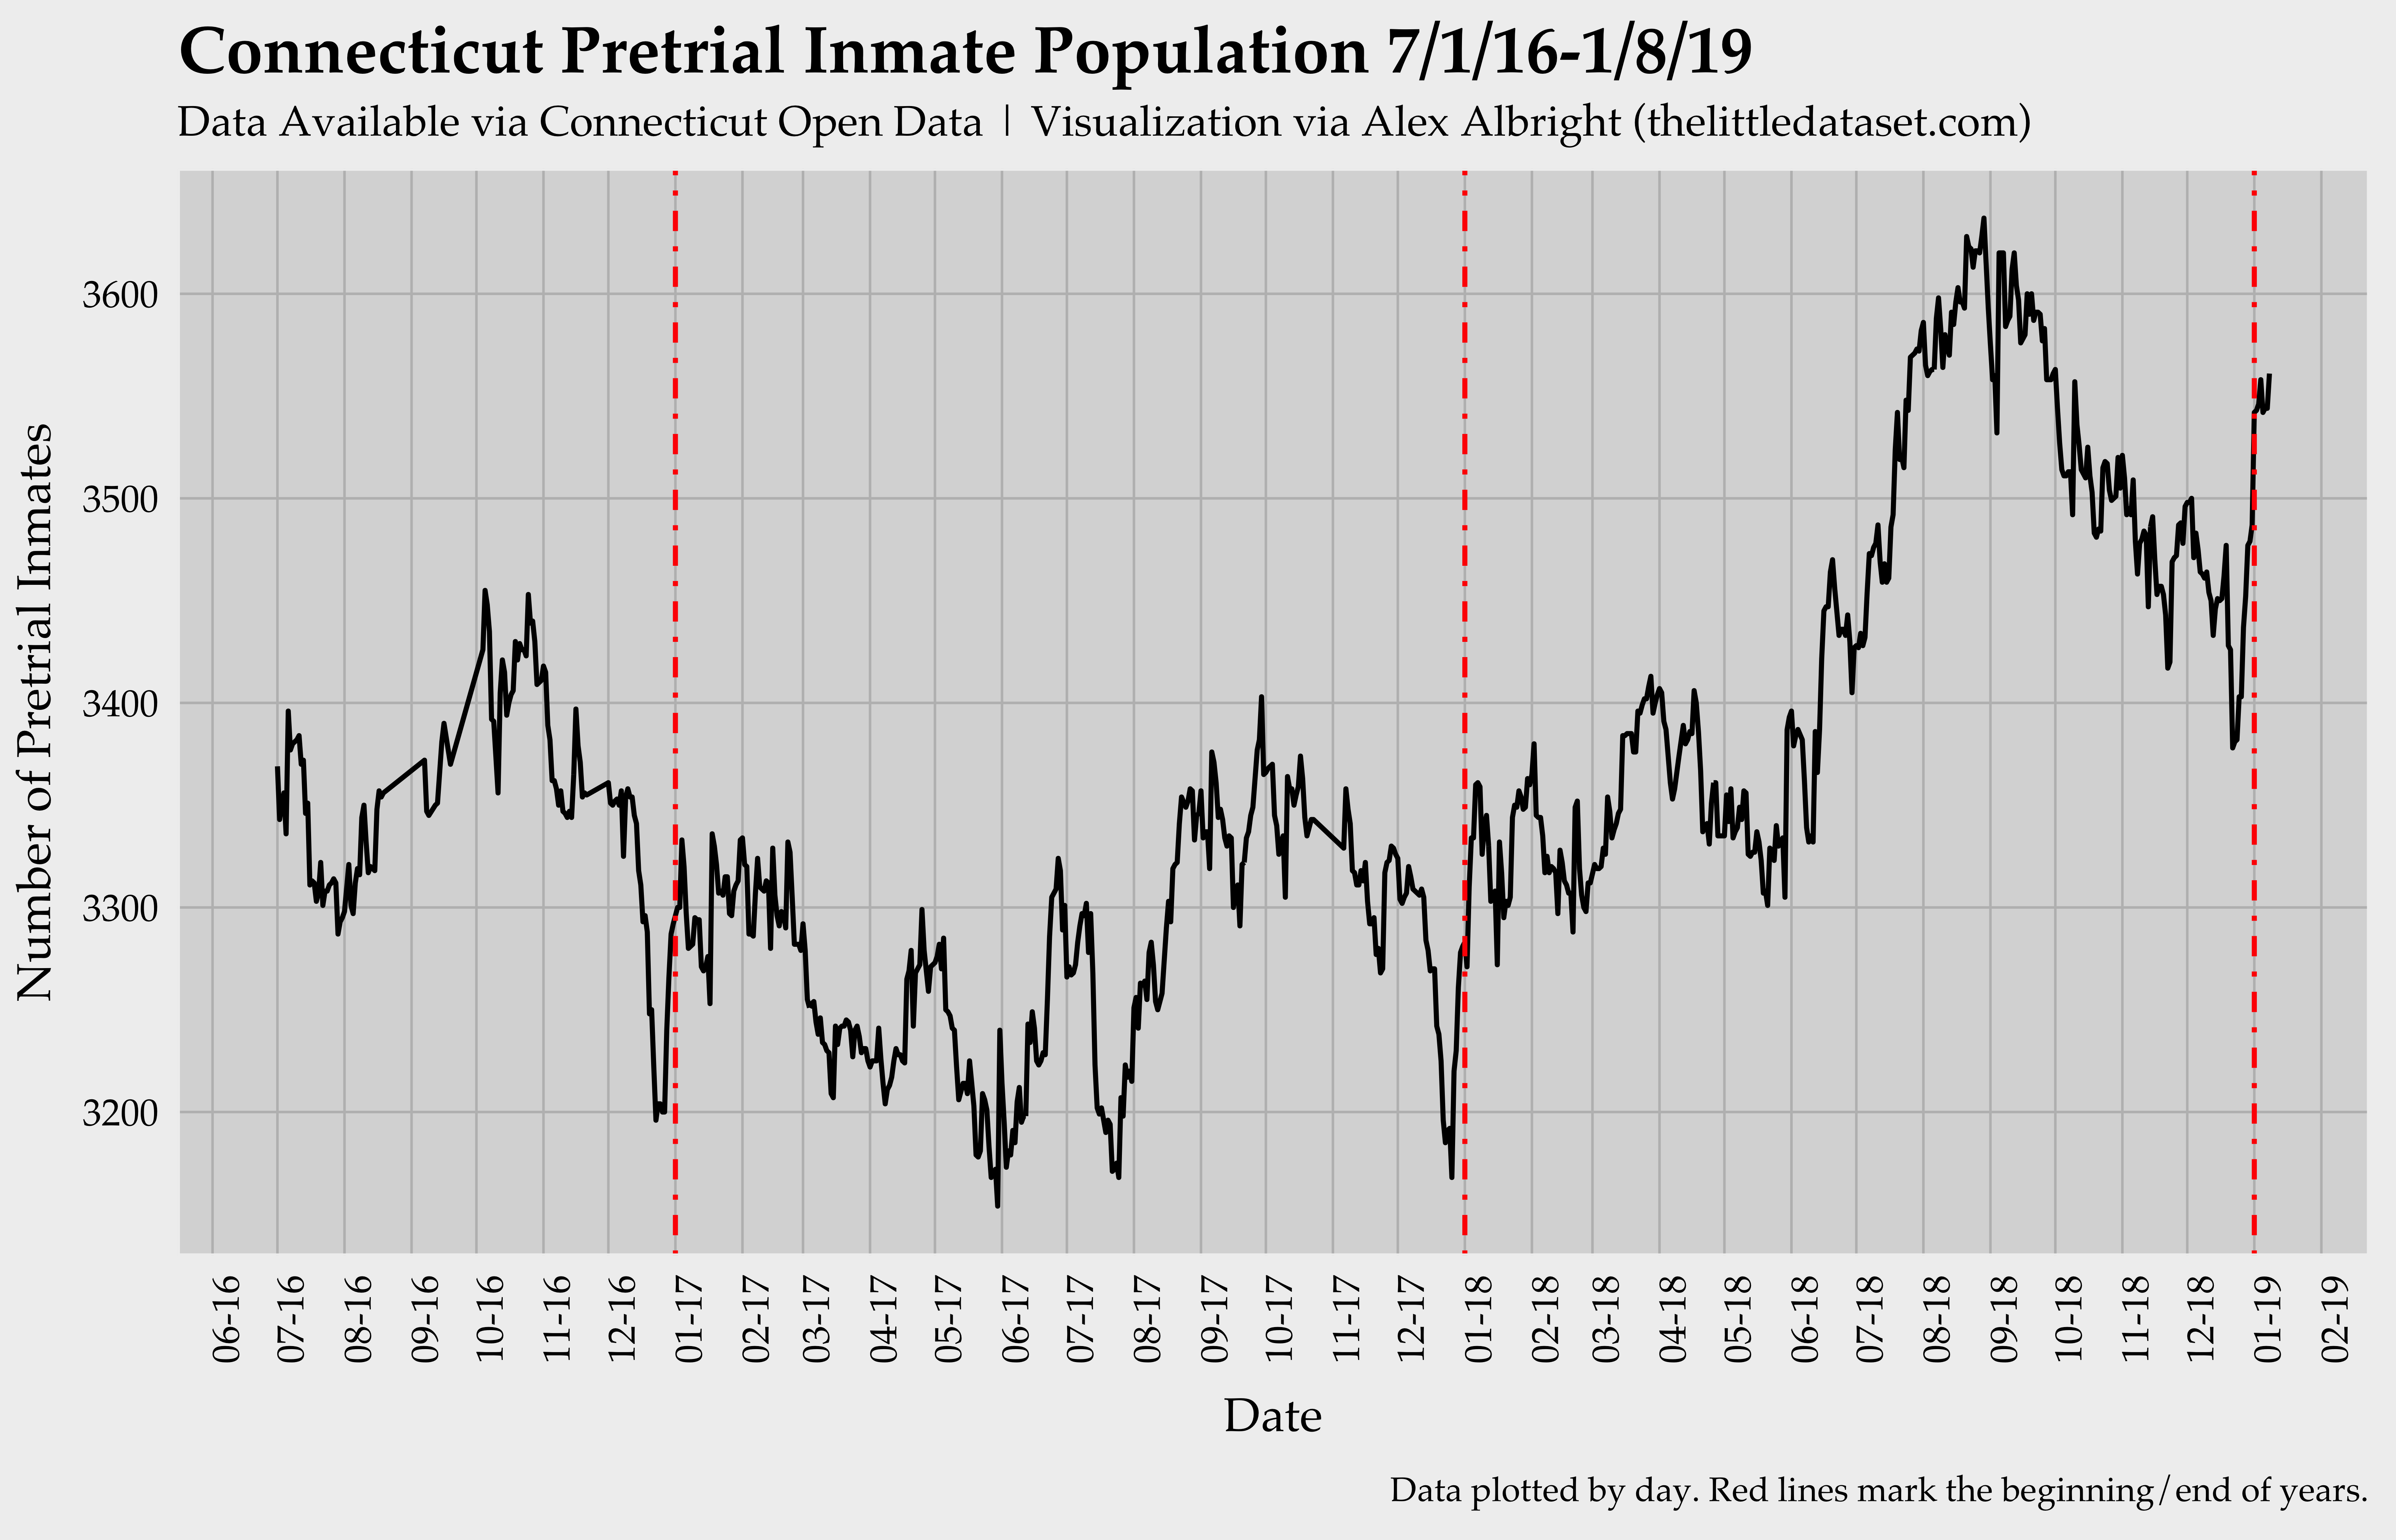
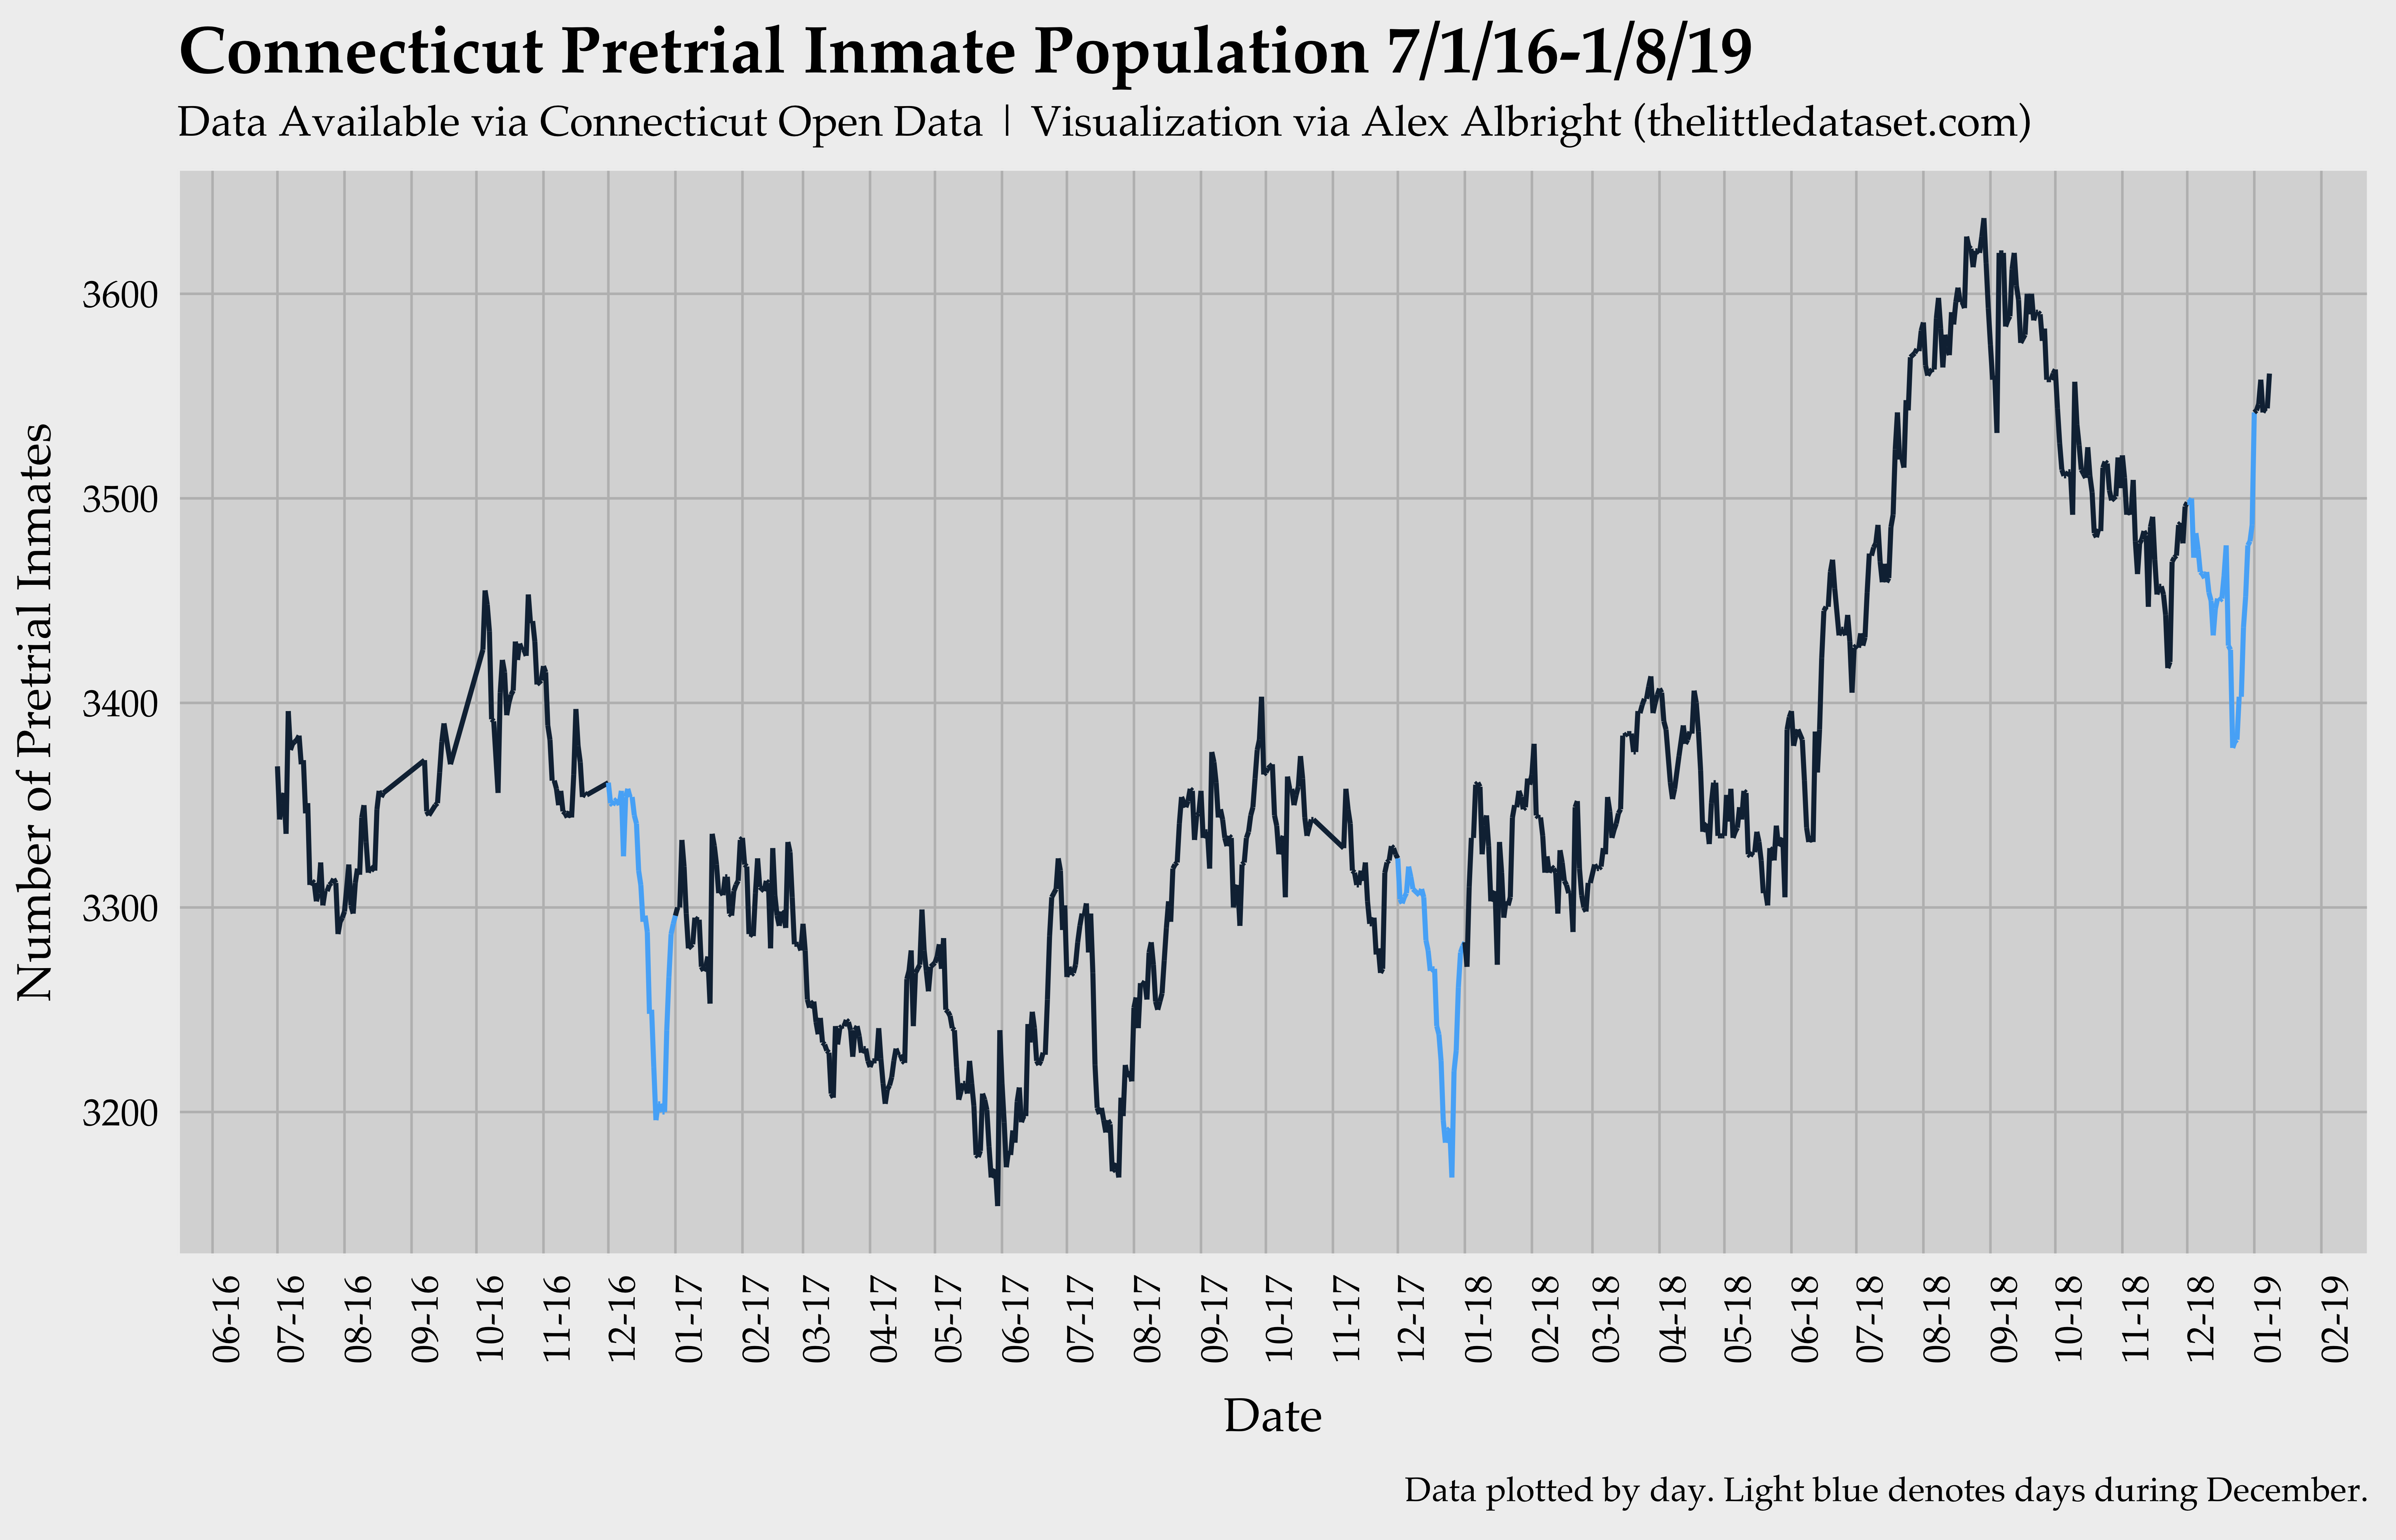
The red lines make clear that there are dips down and back up right around the end of the year. The following figure (which colors December in blue) clarifies that this dip is in fact happening during the month of Christmas.
I then zoom into December for each of the three months and look at the micro-level day-to-day variation. I place red and green “ornaments”6 on Christmas Eve and Christmas to demonstrate that those two days coincide with the end of the dip down in the pretrial inmate population.
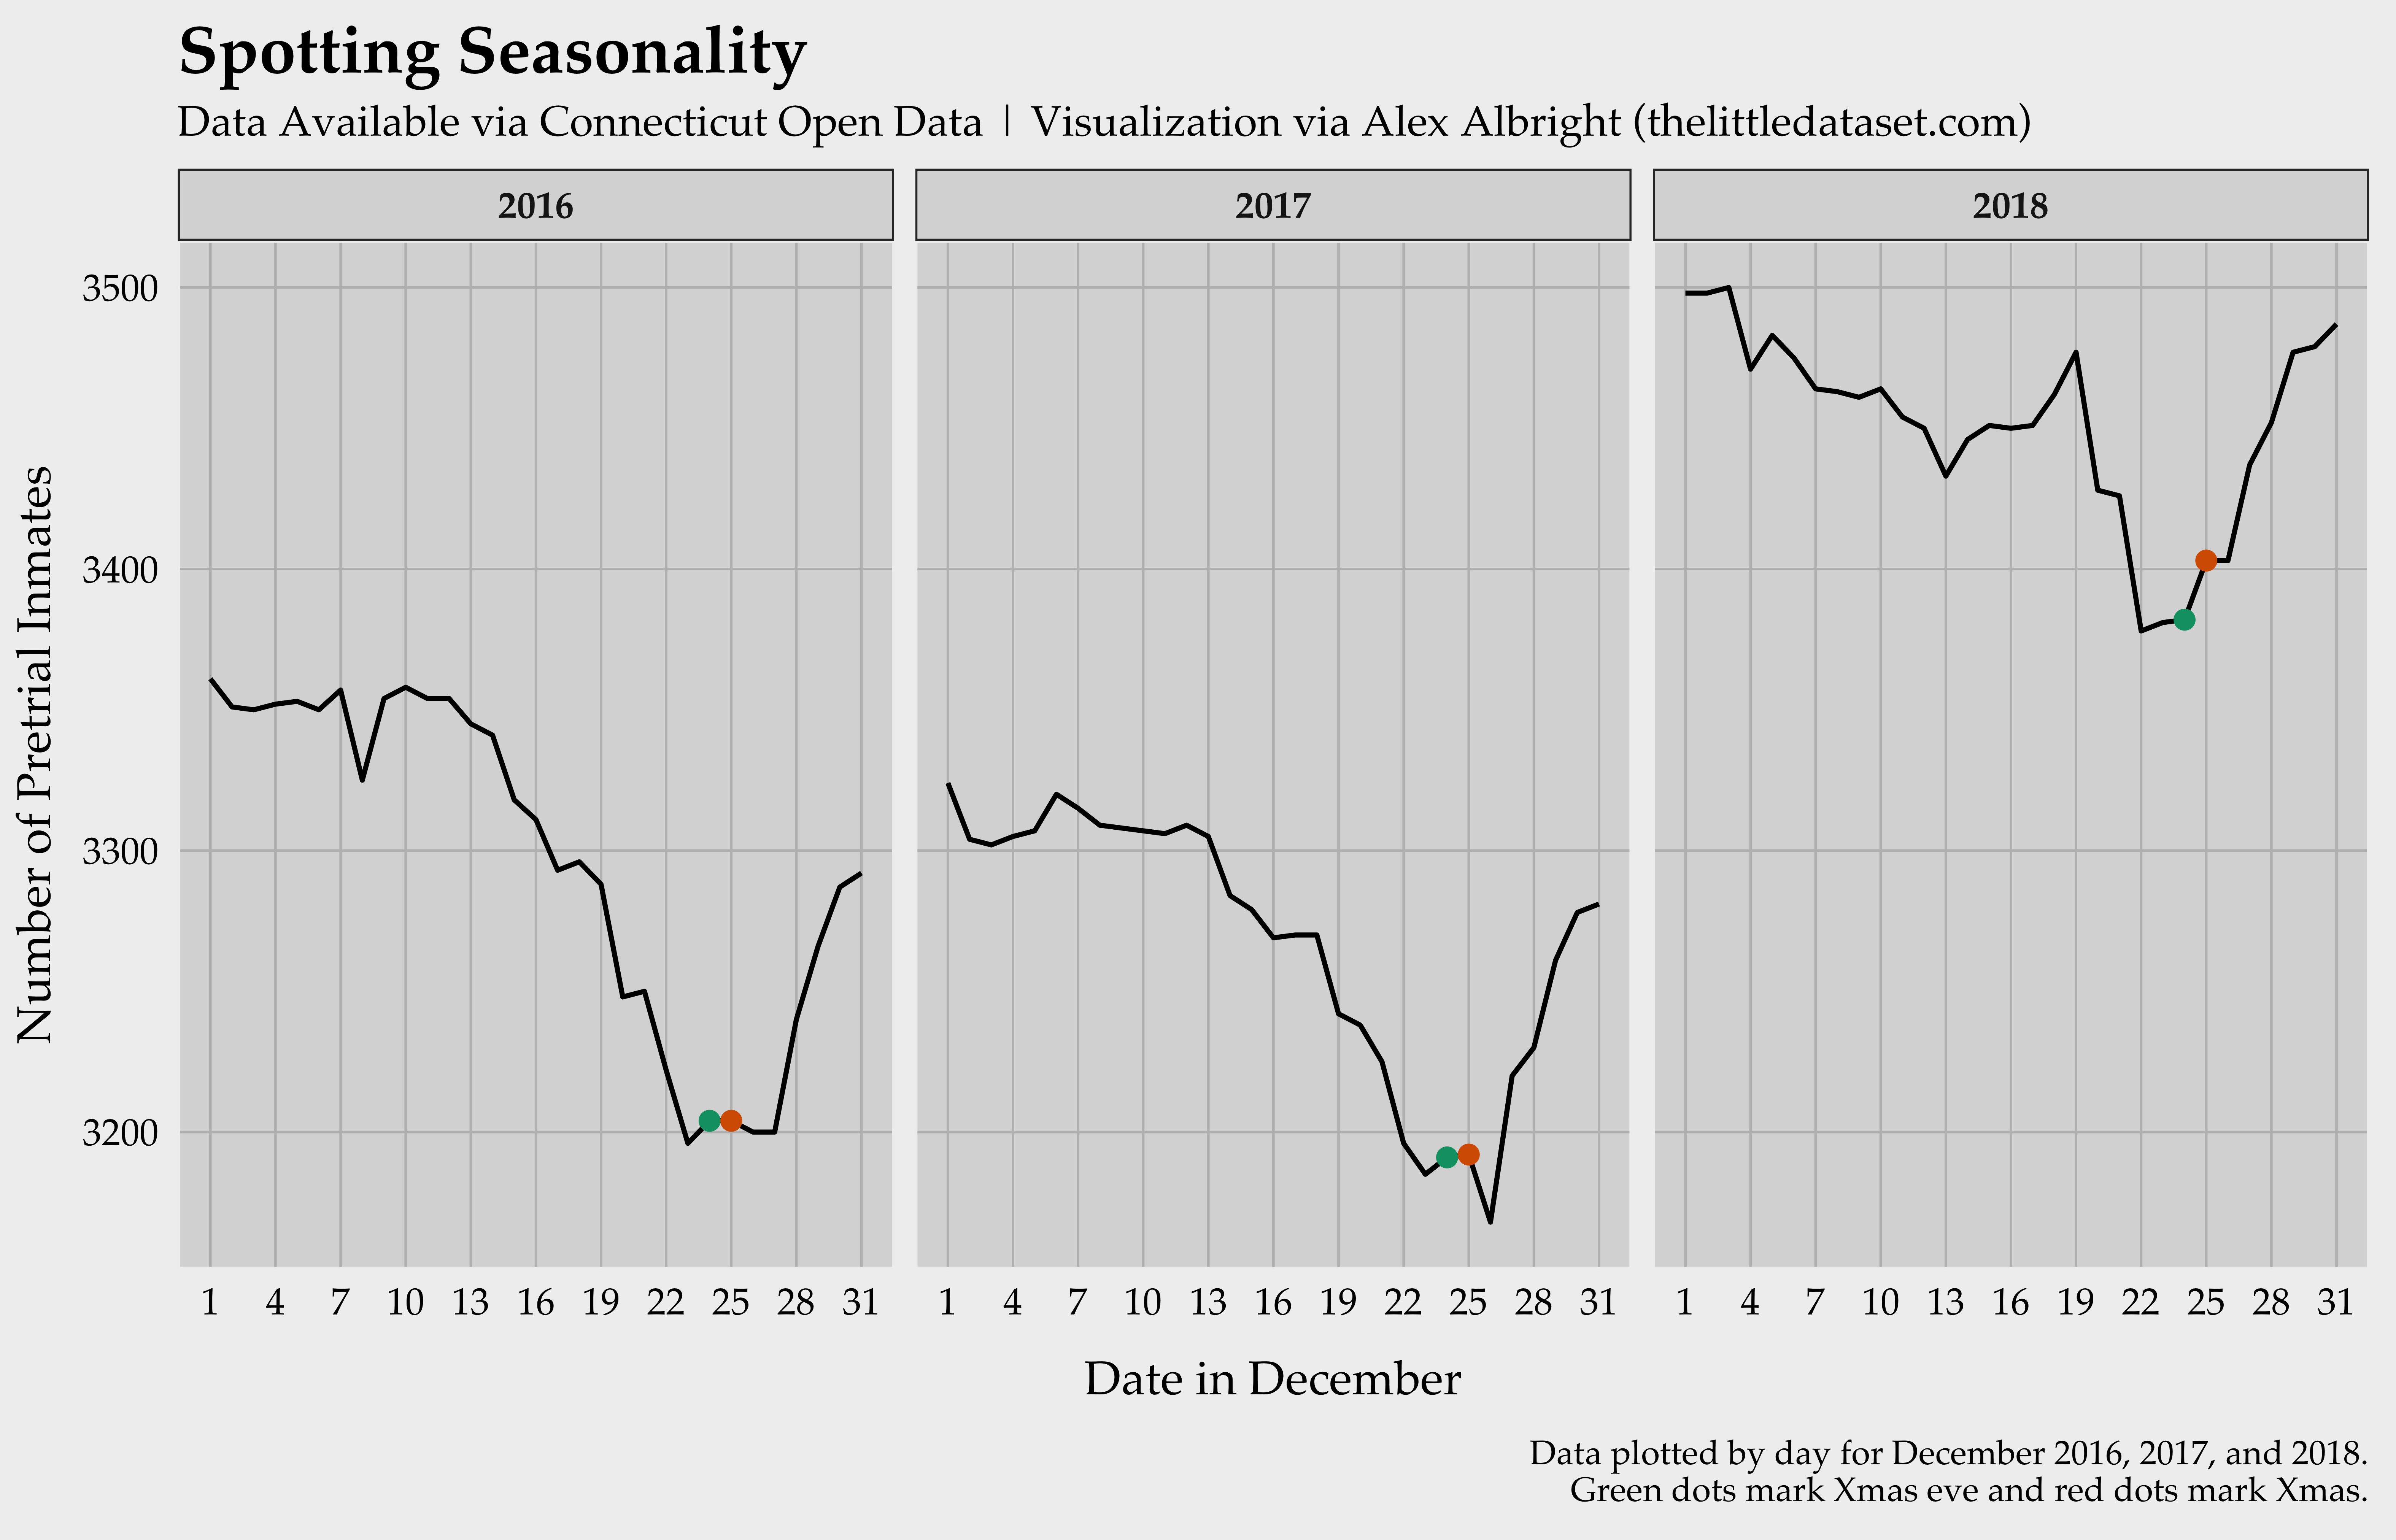
The story seems consistent over the three years presented above: Christmas time is a meaningful driver of lower jail populations. As such, the lower year-end counts that the BJS observes could (at least partially) be due to the lingering effects of the Christmas holiday on both arrests and bail behavior. Christmas might lower the number of pretrial inmates due to (i) an abnormally low intake of new accused inmates as well as (ii) an abnormally high release of inmates, which could be due to a relatively higher rate of bail-posting.78 The latter is the mechanism of the most interest to me, however, data limitations do not allow me to plot bail postings by day.
Daily Counts vs. Yearly Flows
Usually, when we talk about the number of people in jail or prison, we use statistics from the Bureau of Justice Statistics to refer to the number of people in jail or prison on a single day. According to the most recent BJS reports, there were about 1.5 million prison inmates as of 12/31/16 and about 740,700 jail inmates as of mid-year 2016. As law professor John Pfaff9 points out during an interview on the podcast Justice in America, these counts might give you the sense that the prison system is larger than the jail system. However, while the 1.5 million “is a fairly close estimate of the total number of people who are in prison at some point during the course of the year,” the “one day count grossly underestimates the number of people actually flow through jail in any given year” because prison sentences (years) are much longer than stays in jail (days/weeks/months). The BJS reports 10.6 million admissions to jails over the course of 2016, which could correspond to something like 6-7 million (as estimated by Pfaff) unique individuals getting sent to jail for some time each year. Pfaff’s estimates make clear that using daily count statistics massively understates the magnitude of the jail system relative to the prison system.
A quick run-through the 2018 Connecticut numbers shows us that while there were 3,283 pretrial inmates in Connecticut on 1/1/18, 15,972 unique people were detained for some period of time in 2018. In other words, about 5 times as many people flow through the Connecticut pretrial detention system over the year as are represented in a daily count. Given that about 500,000 people await trial in jails each day, that factor (if nationally representative) could imply that ~2.5 million unique people are detained pretrial each year. In his discussion at the national level, Prof Pfaff estimates that about 8-9 times as many people10 flow through jail over the year as are represented in a daily count. If we use that factor instead, that could imply that as many as 4.5 million unique people are detained pretrial each year.
Why is this important? As pretrial/bail reform discussions continue to evolve around the country,11(https://www.sacbee.com/news/politics-government/capitol-alert/article217461380.html) as of October 2019. New Jersey mostly eliminated money bail back in 2017.] it is crucial to emphasize the magnitude of the population that stands to be impacted by reforms.12 Using daily counts in the hundreds of thousands rather than estimates in the millions (which surpass the prison population) means massively understating – to borrow Prof Pfaff’s phrasing – “the human contact” of pretrial detention.13
Further Exploration
I’ll be writing up another post in the coming weeks that explores bond amounts and length of jail stays in Connecticut. I’ll also illustrate differences by demographic groups and describe what data limitations render this a casual rather than causal exercise.
Data/Code
- The pretrial inmate dataset is available via Connecticut Open data here.
- See here for my R notebook, see here for my Github repo
-
Publicly available data is usually aggregated across people or time. I.e., there is no individual-level information and/or data collection is infrequent (say, once a year). ↩︎
-
Kudos to Data is Plural for blasting this out way back when in summer 2016. ↩︎
-
Usually, the statistics on pretrial detention are more static in that they are collected on an annual or semi-annual basis. (I’m thinking of BJS reports.) ↩︎
-
The 2016 BJS Jail Inmates report breaks the inmate population down into “convicted” and “unconvicted” for the year-end 2016 numbers: 458,600 out of the 704,500 jail inmates at year-end 2016 are “unconvicted” (i.e., they are pretrial). Note: the BJS uses year-end in this case since for 2015 and 2016 the Annual Survey of Jails collected data on inmate populations at year-end instead of midyear (as they had done 2000-2014). ↩︎
-
This calculation from 2016 BJS numbers is in line with Justice in America’s claim that pretrial inmates account for more than 60% of the national jail population. ↩︎
-
I.e., dots. ↩︎
-
I unfortunately can’t see why an individual leaves the dataset; it could be that bail was posted (meaning they are out of jail and awaiting trial) or that they are no longer pretrial (meaning they could be free, in jail for a shorter sentence, or in prison for a longer sentence). ↩︎
-
In terms of further work, one could test which (out of (i) and (ii)) is the stronger force by calculating the number of new inmates per day as well as the number of released inmates per day and graphing these over the December months. ↩︎
-
Pfaff is the author of the book Locked In: The True Causes of Mass Incarceration and How to Achieve Real Reform. ↩︎
-
He assumed about 750,000 people are in jail on a given day and estimated 6-7 million people get sent to jail each year. ↩︎
-
Bail reform increasingly means elimination of cash bail. California will be the first state to [fully eliminate money bail ↩︎
-
On a related note, Sociologist Sarah Shannon et al. estimate (in this 2017 Demography paper) that, as of 2010, there were a whopping 19 million people in the US with felony records. This is another set of crucial estimates for understanding the population size affected by criminal justice policies – in this case, policies such as occupational licensing restrictions, voting restrictions, and ban the box. ↩︎
-
A recent Pew Center report shows strong support for reducing pretrial detention. ↩︎