Preface
I recently returned from ECINEQ 2019 at the Paris School of Economics, where I was very excited to present an ongoing project about risk assessment scores in the criminal justice system. Since I’ve been discussing this project for a while in my academic life, it feels like the right time to translate it into blog form! Sure, you could read this working paper draft or click through these slides but the former is long and the latter lacks narration. As such, this feels like the ideal way to succinctly communicate my work from afar… this is also solid self-prep for all those interactions that involve the question “what is your research about?”
Motivation
High-stakes decisions are increasingly informed by data-driven prediction tools. Loan officers use credit scores to help make lending decisions, managers use predictions in making hiring decisions, and judges use risk assessments to set bail. When it comes to criminal justice, scores (generated based on individual-level characteristics) are used in bail, pretrial, or sentencing hearings in 49 of the 50 states.1
Usage of such predictive tools is controversial,2 especially in the context of criminal justice.3 Advocates argue that their embrace could weaken the role human biases play in high-stakes decision-making.4 However, opponents are concerned that the tools themselves are biased against disadvantaged groups. (ProPublica wrote an article in 2016 with the subtitle, “There’s software used across the country to predict future criminals. And it’s biased against blacks.” Michelle Alexander, author of The New Jim Crow, has even called risk assessment scores “The Newest Jim Crow”.)
This ongoing debate is primarily focused on the predictions and biases of predictive tools (risk scores) in isolation. That is, what are the scores? How do the predictions pan out? Are they “fair”?5 However, it is crucial to acknowledge that these scores are tools given to human decision-makers for interpretation. Human discretion means that there is not necessarily a one-to-one mapping from the predictive tool’s recommendation to the final outcome. (In many jurisdictions, scores are associated with a recommended action, but judges have the ability to adhere or defect from these recommendations.) Therefore, a hugely important and understudied question is: how are the scores used? Of particular policy interest is the following question: are predictive recommendations followed similarly across racial groups?
In short, the effects of risk score policies on racial disparities are dependent on two forces: (1) the risk score recommendations (and how they differ by defendant race), and (2) how decision-makers adhere to/deviate from those recommendations (and how adherence/deviation differs by defendant race). Given the ample writing (both popular and academic) on (1), I am using this project to provide empirical evidence on channel (2).6
Setting
To provide empirical evidence on this topic, I focus on a policy change in the Kentucky pretrial environment, Kentucky House Bill 463. I first read about this policy change thanks to Megan Stevenson’s 2017 paper on the topic. (My work directly builds on hers in many ways, so definitely check that paper out if you’re interested in these topics.) During 2009-2013 in Kentucky, judges made initial bond decisions about defendants within 24 hours of the defendant’s booking.7 Those decisions were usually made within a few minutes based on information shared by a Pretrial Officer. Before HB463, judicial consideration of a defendant’s risk assessment score level, as calculated by the Kentucky Pretrial Risk Assessment (KPRA), of low, moderate, or high was optional in initial bond decisions (meaning many judges did not know the defendants’ risk levels).8 However, when House Bill 463 (HB463) was enacted on 6/8/11, judges became required to consider the risk score level (again, of low, moderate, or high) in their initial decision. More powerfully, judges were required to set non-financial bond for low and moderate risk defendants unless they give a reason for deviating from this “presumptive default”.9
As such, HB463 did two major things: (1) it required pretrial judges to consider risk scores (that were already in existence and optional) in initial bond decisions, and (2) it made the default outcome for defendants scored as low or moderate non-financial bond (judges could deviate from the recommendation but had to give a reason for doing so).
In Stevenson’s prior work on this topic, she shows that racial disparities in non-financial bond increase discontinuously when HB463 goes into effect. My contribution is to get into why. Are those disparities purely explained by different risk scores (and recommendations) by race? (That is, force (1) from earlier discussion.) Or are the disparities alleviated/exacerbated by judicial discretion? (Force (2) from earlier.)
Results
The Basics
I use case-level data on 383,080 initial bond decisions for male defendants between 7/1/09-6/30/13 from the Kentucky Administrative Office of the Courts.10 This data spans 192,758 distinct defendants and 563 distinct judges.11
The effective date of HB463 leads to a discontinuous jump up in non-financial bond from around 20-25% to around 35% – see below.12

While both black and white defendants benefit (in that there are higher non-financial bond rates), racial disparities clearly increase. See below. This finding was first illustrated by Stevenson (2017).
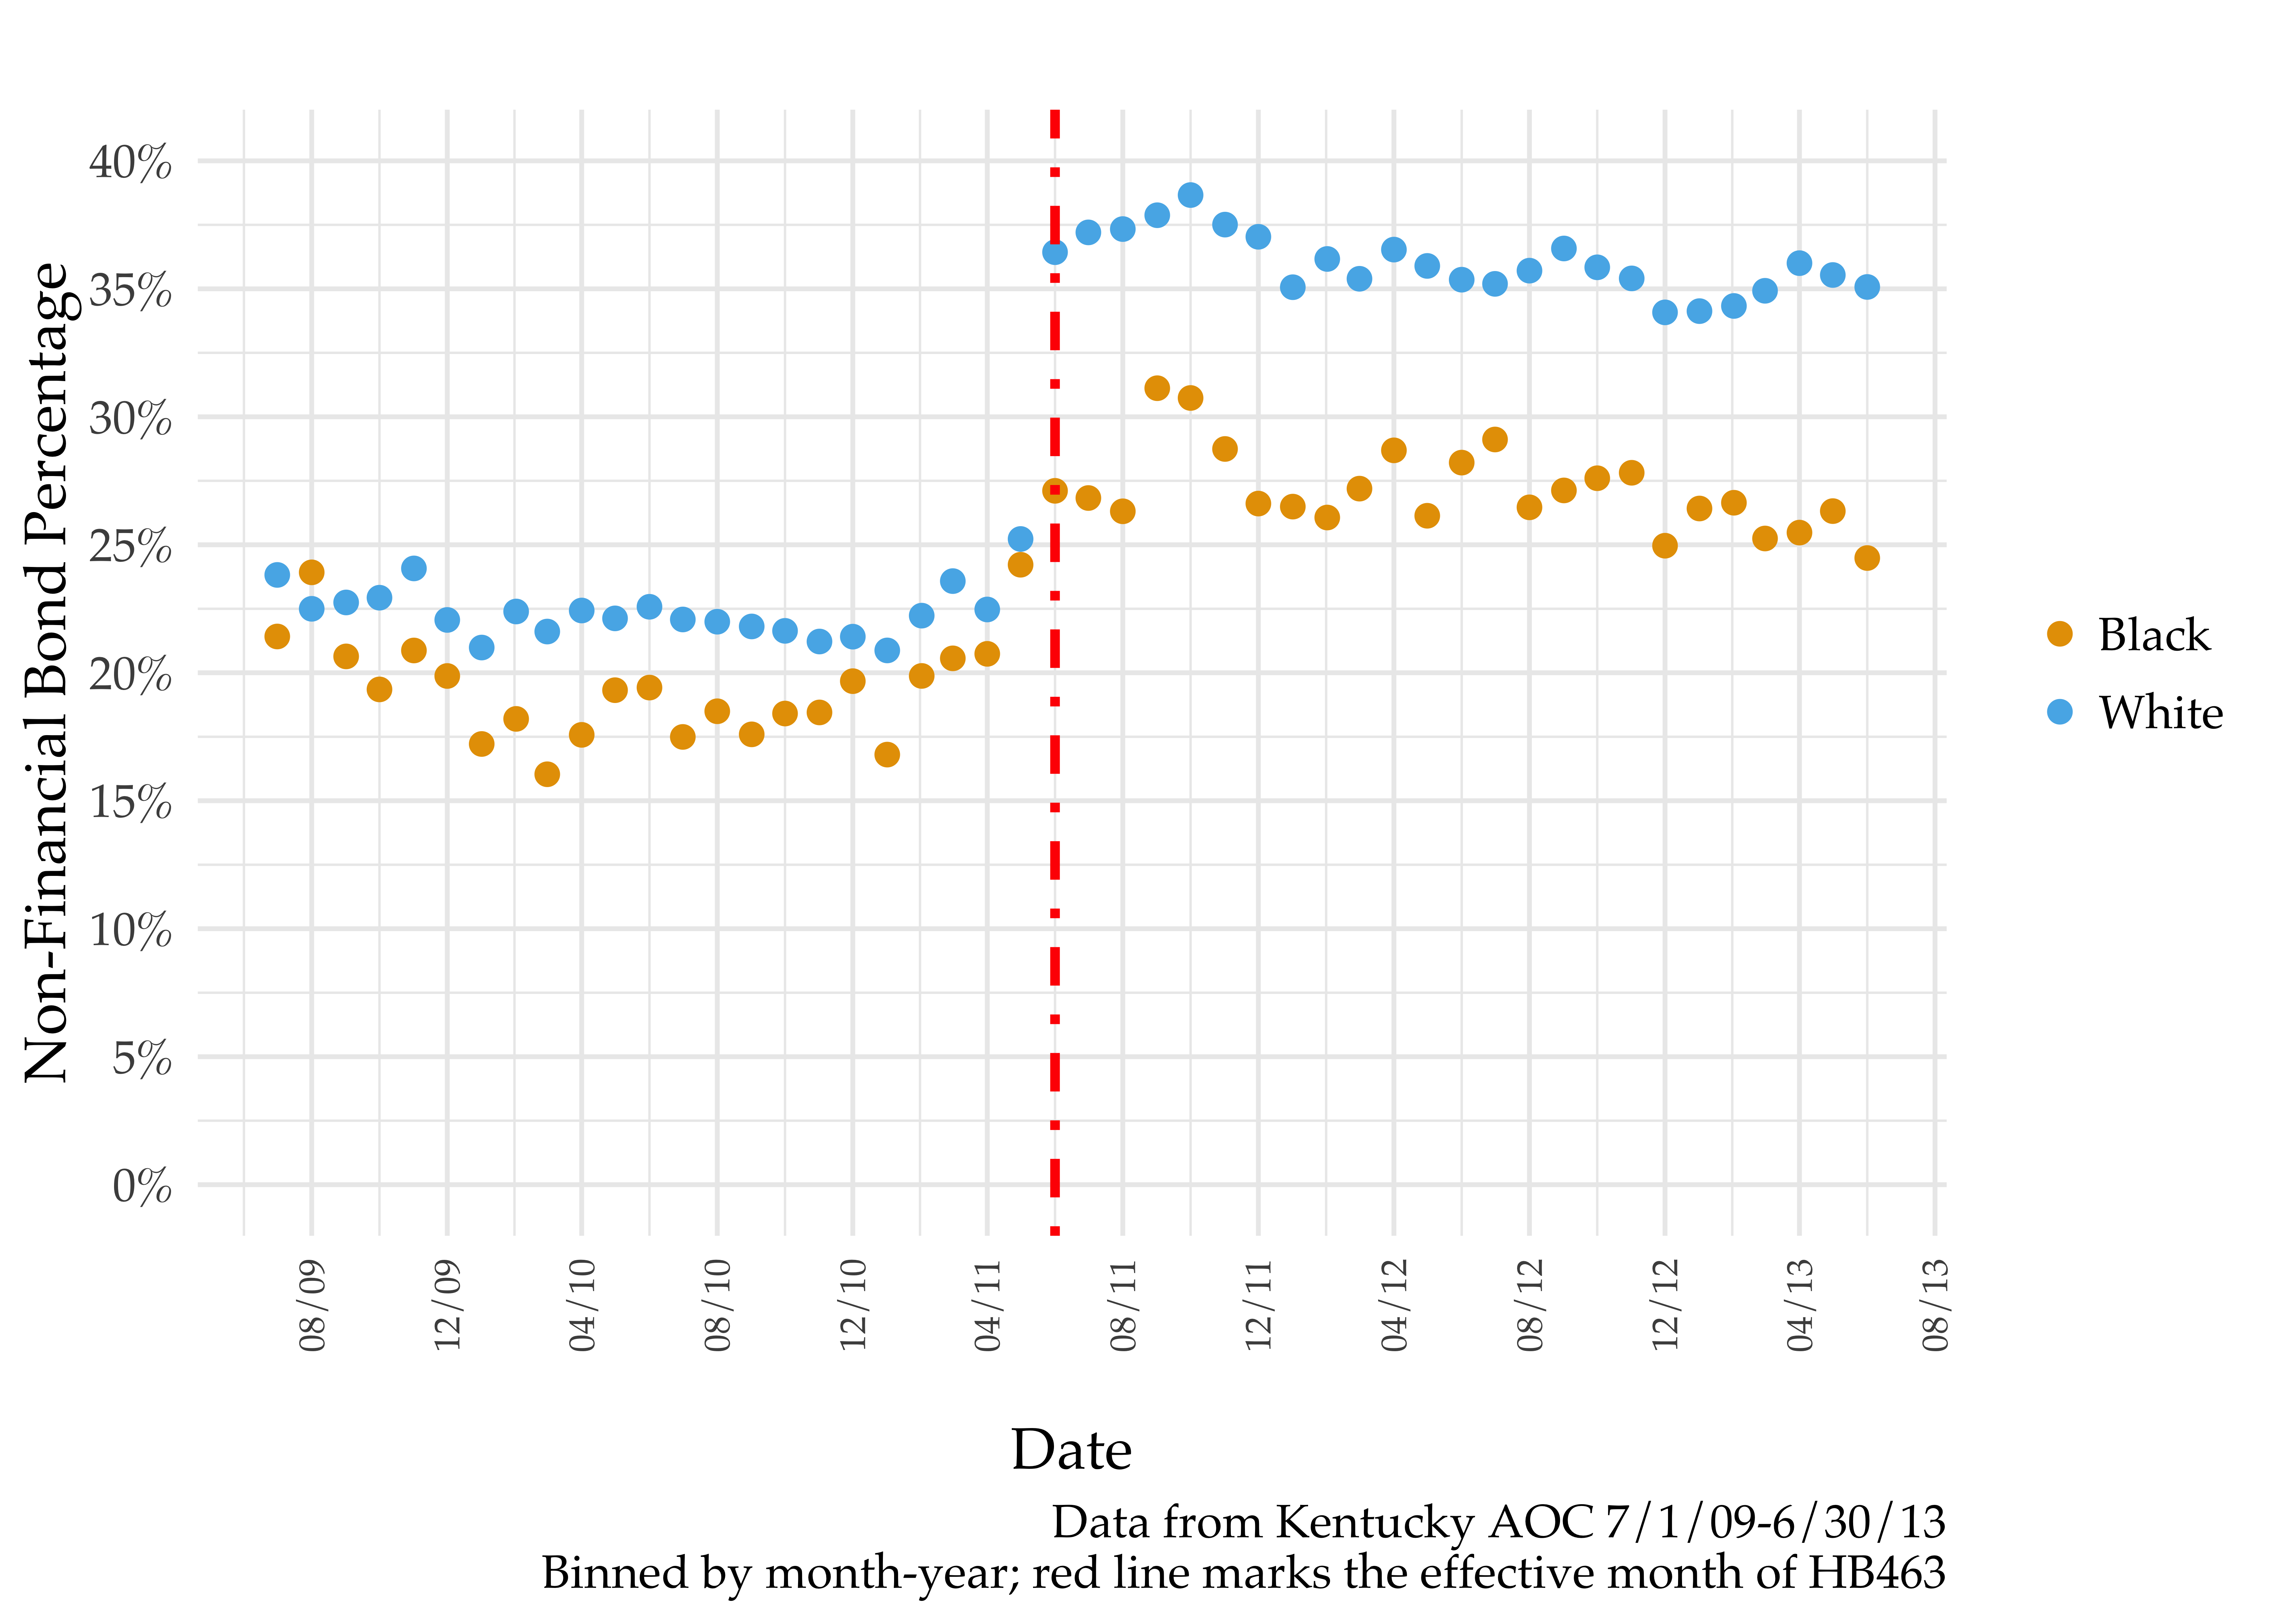
My contribution lies in addressing the following questions: Is the jump in racial disparities in non-financial bond a consequence of different risk levels? Or is deviation from the presumptive default more likely for black defendants?
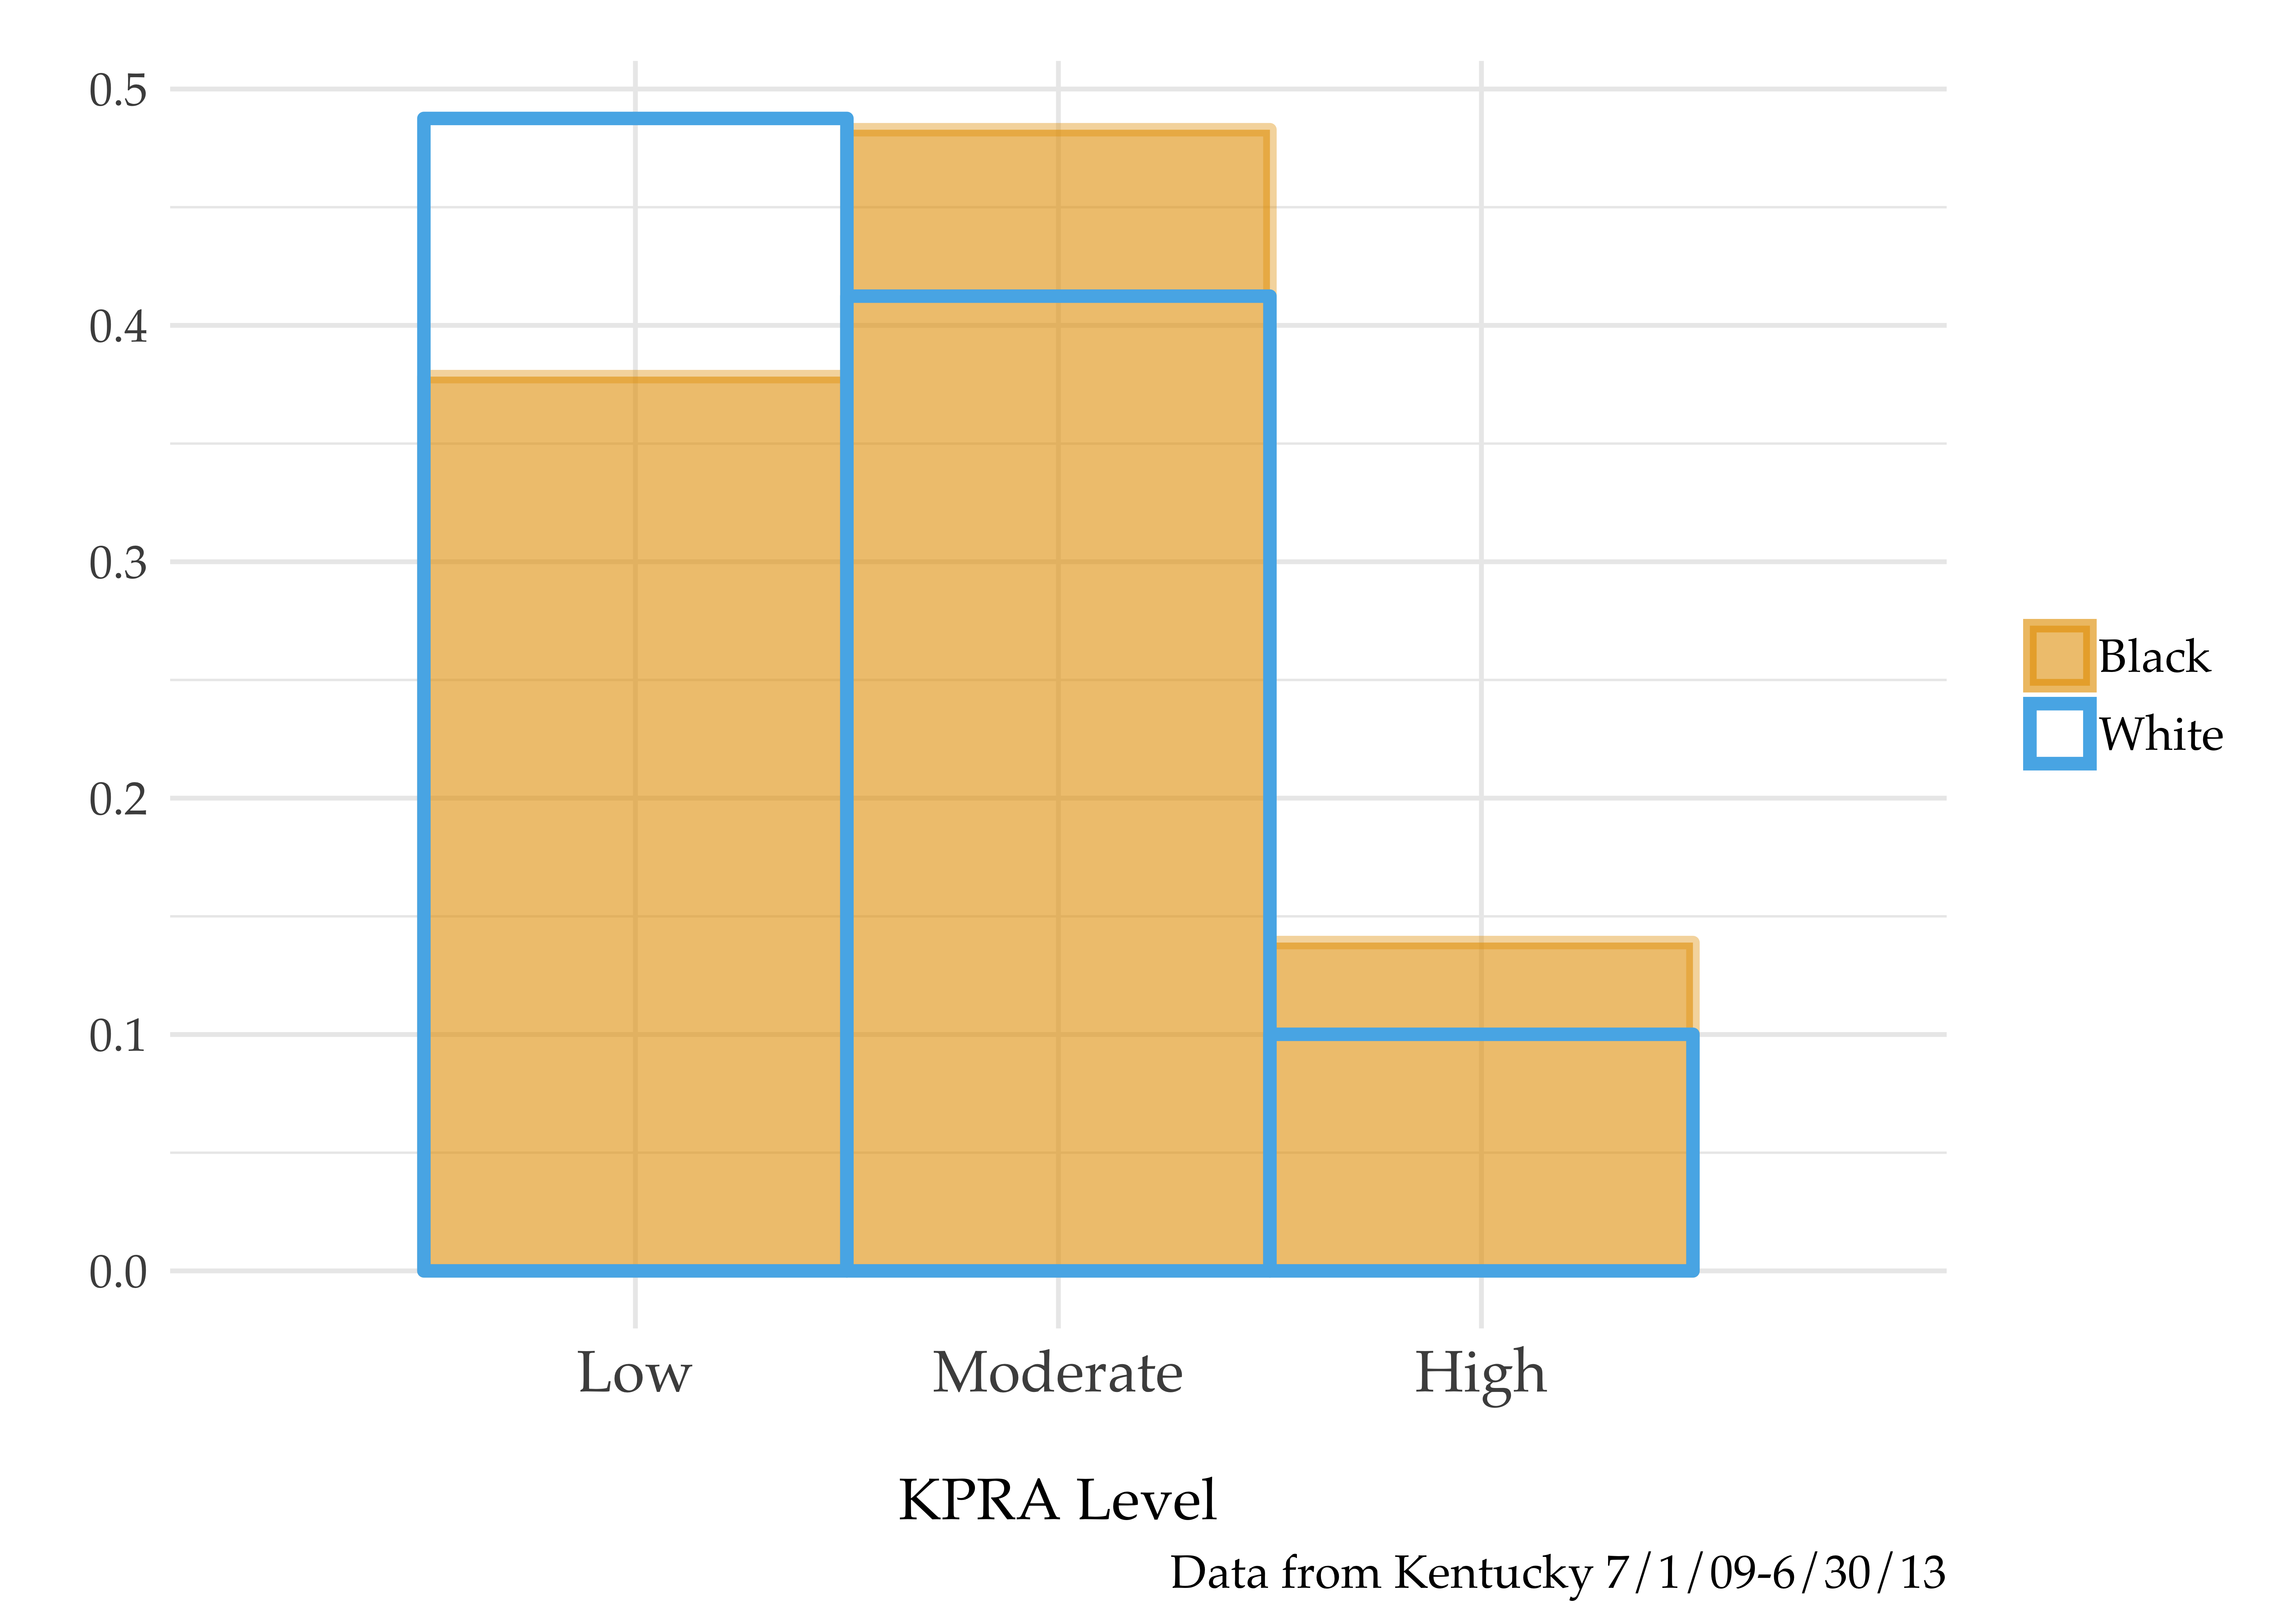
It is true that the KPRA risk assessment level densities look different for black and white defendants.13 The below figure shows that white defendants are more heavily skewed towards the lower-risk levels, while black defendants are more heavily skewed towards the higher-risk levels. Therefore, it’s possible that the different scores (and thus different recommendations) are mechanically responsible for the discontinuous change in racial disparities.
In conceptualizing HB463 as an upward shock to the weight on risk levels in a judge’s bail decision, it would be natural to think this would mechanically shrink racial disparities for low and moderate risk defendants. However, I show empirical evidence to the opposite effect: even within risk levels, there is a discontinuously jump in racial disparities. Thus, forces beyond the scores themselves (i.e., human usage) play a role in the increase in racial disparities.
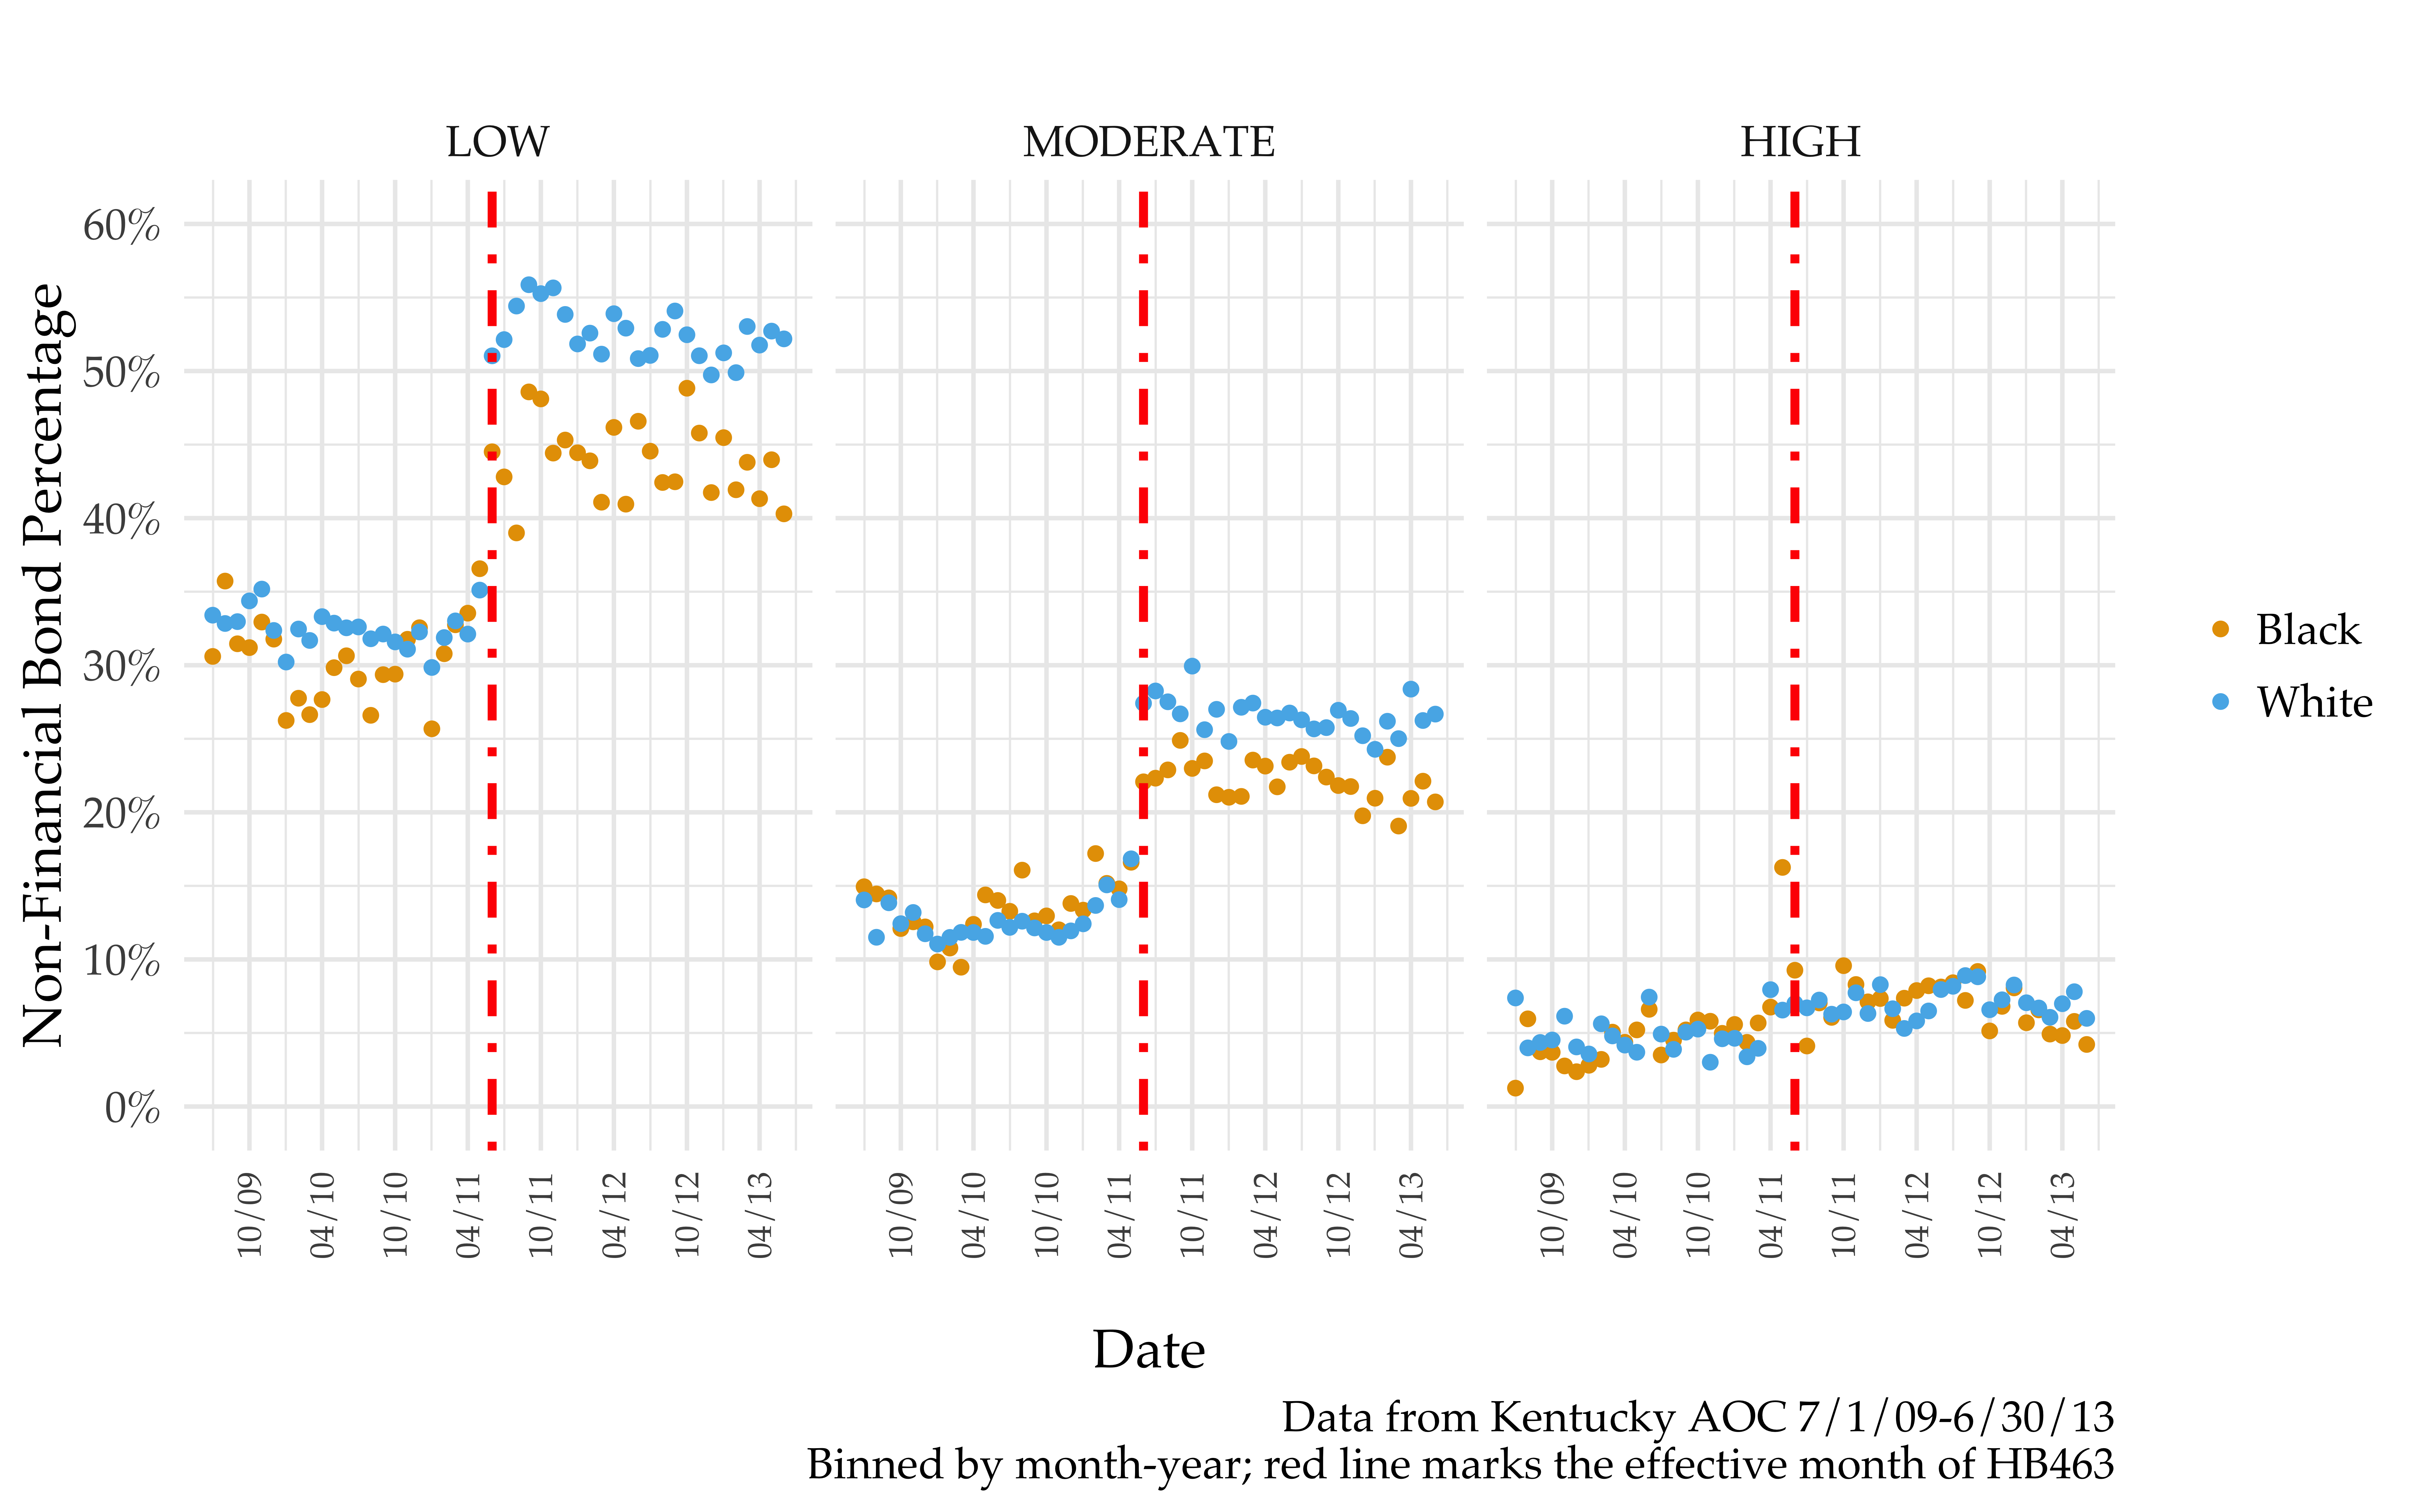
Big take-away: after HB463, the presumptive default (of non-financial bond for low and moderate risk defendants) is more likely to be overridden for black defendants than white defendants.
Why Differences in Deviations?
What drives these differences in deviations across racial groups? It could be a few things:
- different underlying charges or defendant characteristics (different judge information sets)
- different policy responses across judges
- different treatment of similar defendants within judge and time
Quick sidebar: Different responses by judge (point 2 above) are important to consider given that judges work within specific counties and there is notable spatial variation in percentage of black defendants across the state. Consider this figure for a graphical illustration of the geographic variation in black defendant percentages.
To test out how much of the deviation disparities are explained by these three factors, I estimate three different specifications for each risk level:
(i) Raw specification:
$$b_{it}= \alpha + \phi_1HB463_t + \phi_2 Black_i + \phi_3 (Black_i \times HB463_t) + \epsilon_{it}$$
(ii) Specification with judge information set:14
$$b_{ijct}= \alpha + \phi_1HB463_t + \phi_2 Black_i + \phi_3 (Black_i \times HB463_t) + \beta_1 \kappa_c + \beta_2 \delta_i + \omega_{t} + x_t + \epsilon_{ijct}$$
(iii) Specification with judge information set and time-varying judge fixed-effects:
$$b_{ijct}= \alpha + \phi_1HB463_t + \phi_2 Black_i + \phi_3 (Black_i \times HB463_t) + \beta_1 \kappa_c + \beta_2 \delta_i + \omega_{jt} + \epsilon_{ijct}$$
In all these specifications,
$b$: dummy variable for non-financial bond$\kappa_c$: vector of charge variables (severity, characteristics of offense)$\delta_i$: vector of defendant variables (characteristics, criminal history variables)$\omega_{j}$: judge FEs;$x_t$: time FEs$\omega_{jt}$: time-varying (month-year) judge FEs$\phi_3$: coefficient of interest
The basic idea here is to see how the coefficient of interest $\phi_3$ changes across the three specifications. The below figure illustrates just that.
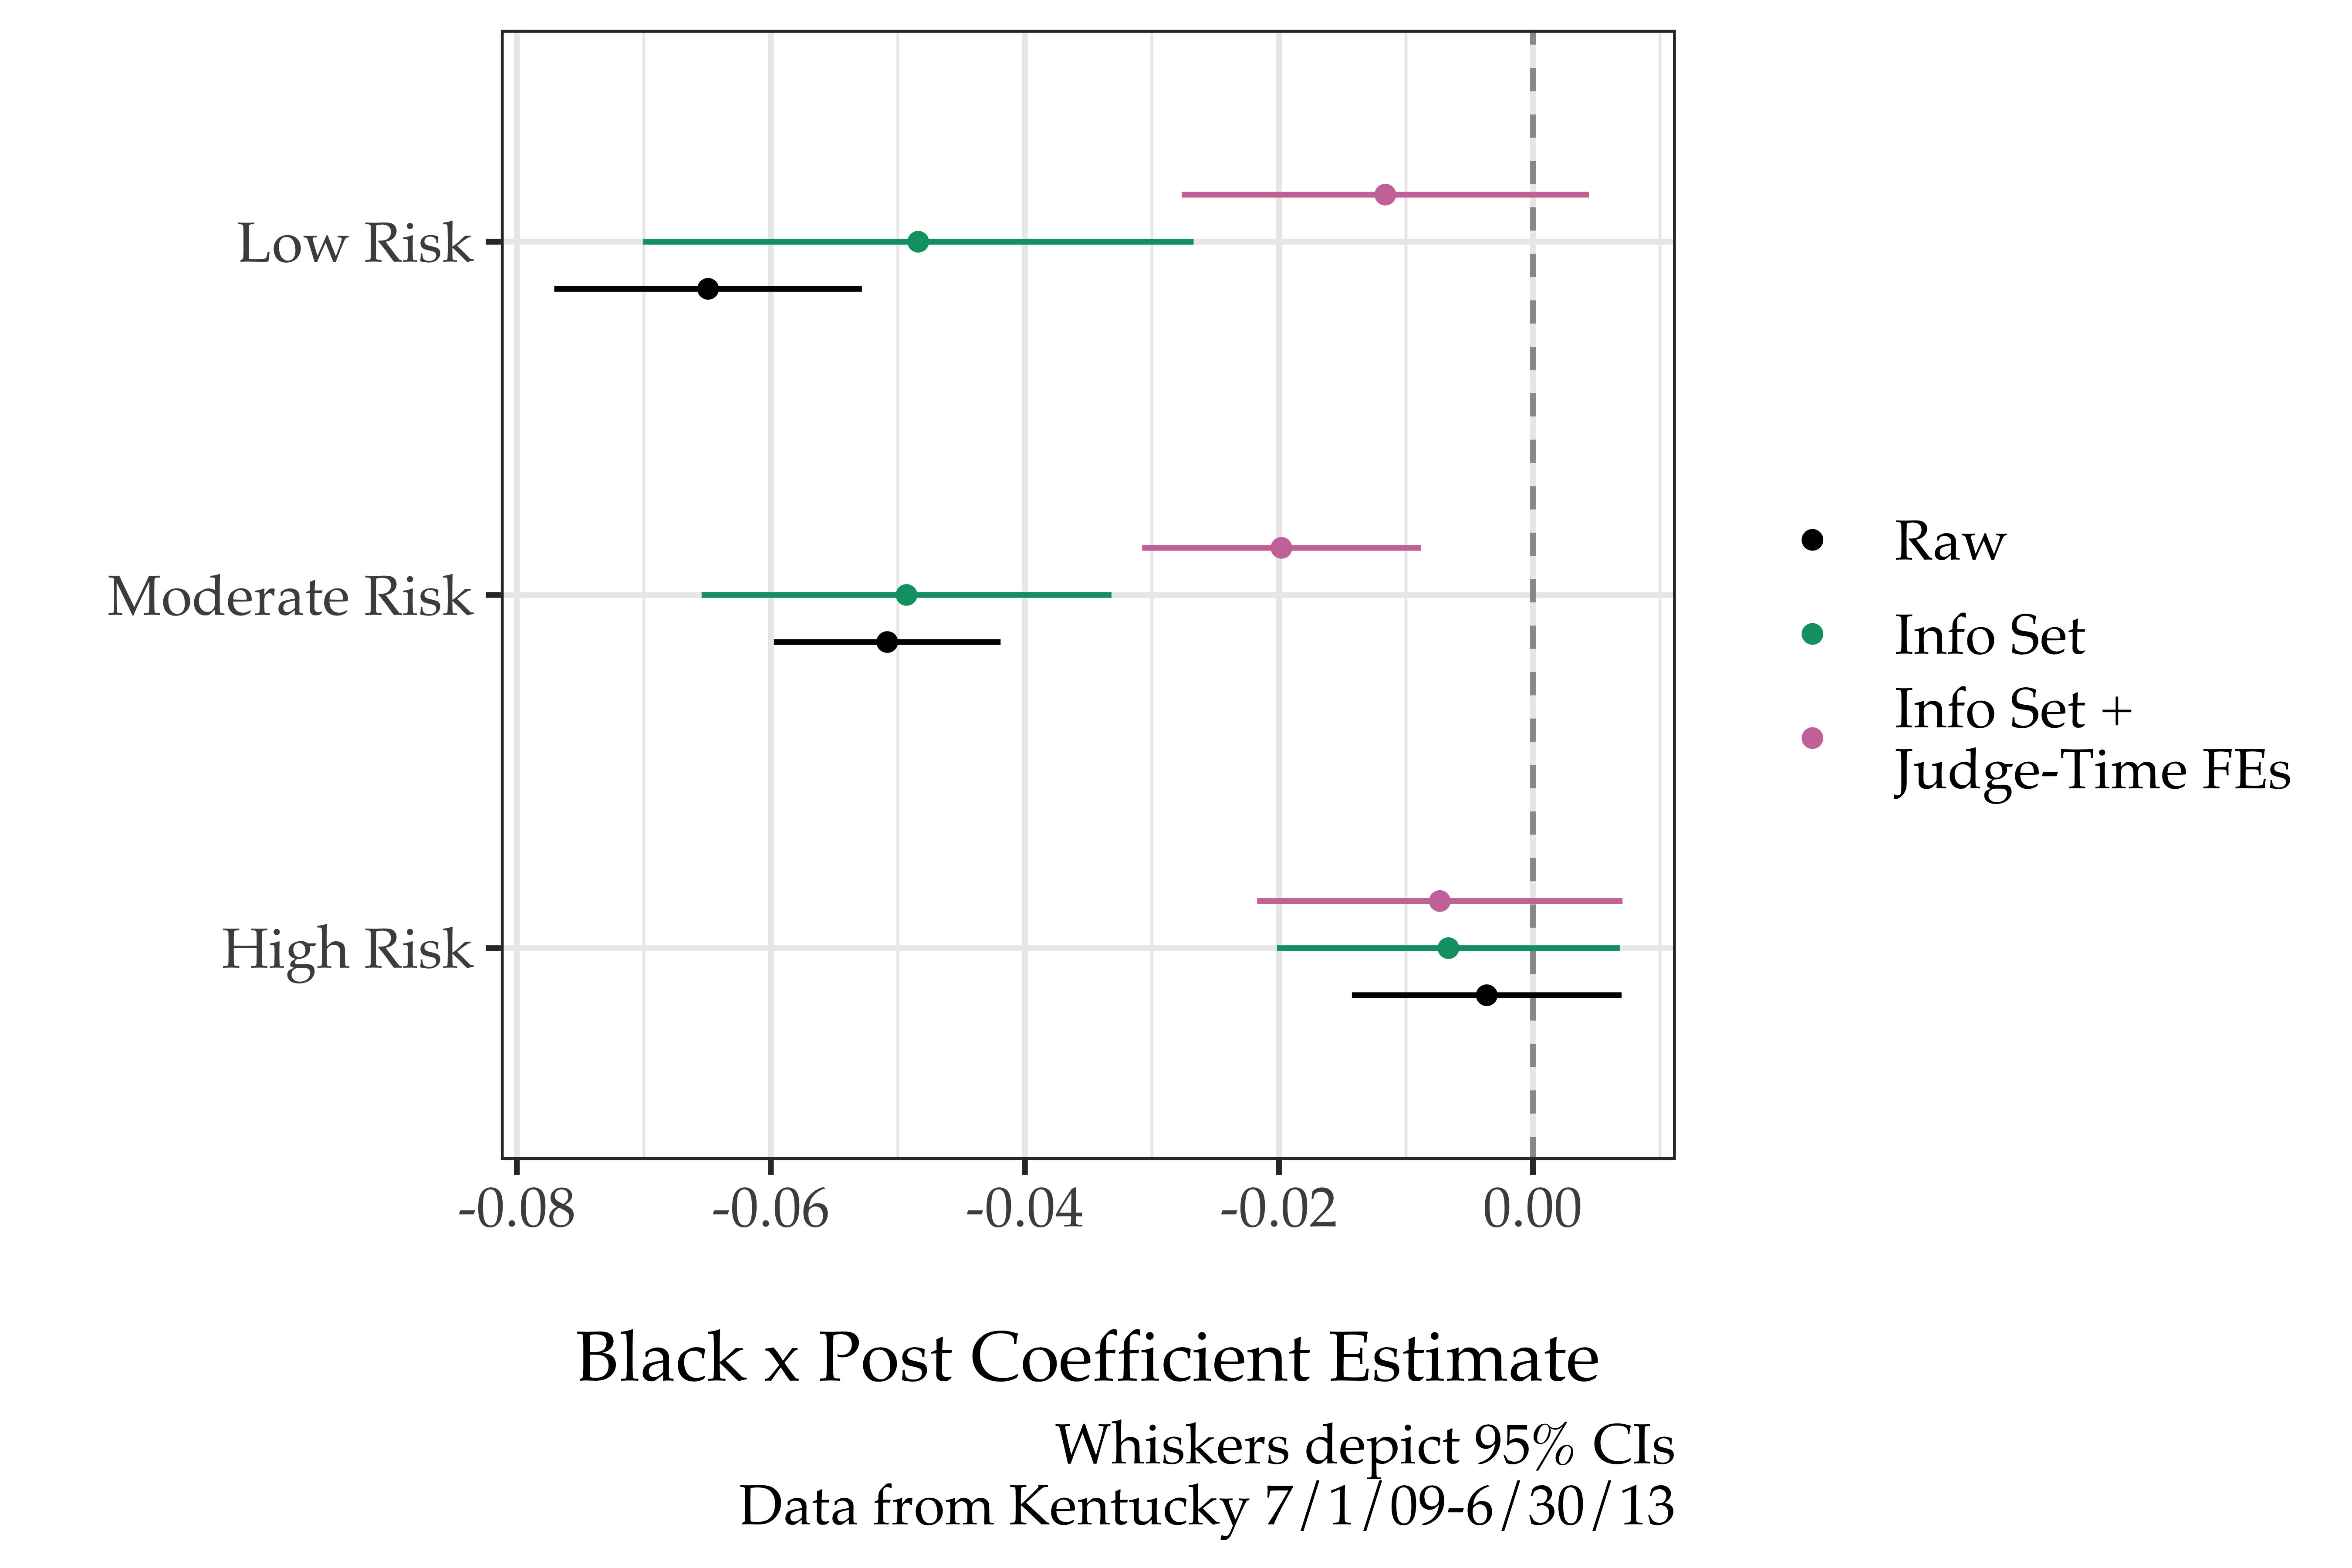
The full results table with estimates for $\phi_1$, $\phi_2$, and $\phi_3$ is below:
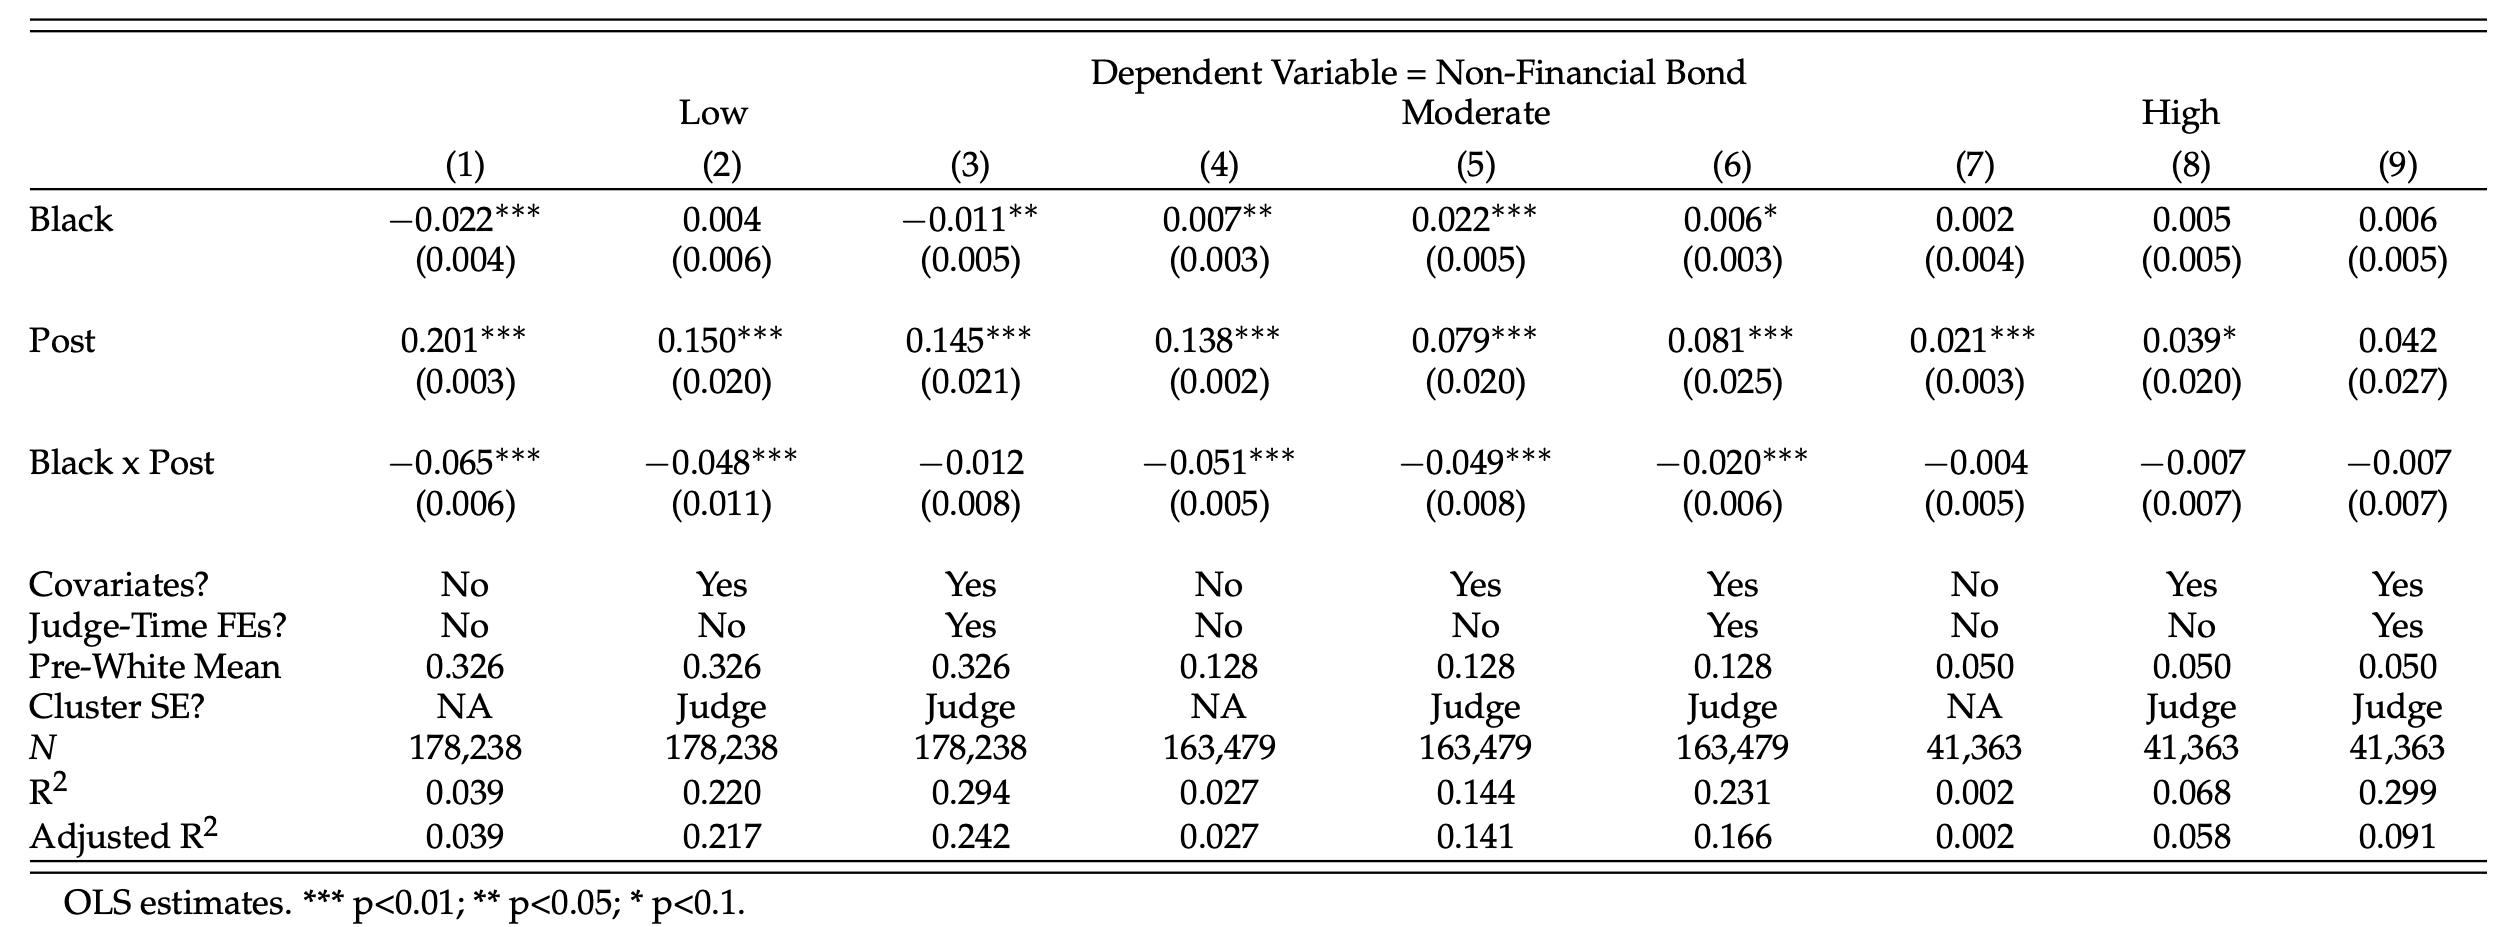
There are a few key take-aways here. For one, in the post-period white defendants appear to be significantly advantaged even after adjusting for the judge’s information set, meaning differences in cases/individual characteristics weren’t the main drivers of the increased disparities. Second, the changes in disparities for low risk defendants become indistinguishable from zero once judges are allowed to vary in their responsiveness. This means the low risk disparity changes were primarily due to the fact that judges in whiter counties responded more to the new default than judges in blacker counties. Lastly, in the post-period, moderate risk black defendants are less likely than similar white defendants to receive non-financial bond – this is true even after allowing for time-varying judge fixed-effects.
Overall, these results are at odds with the assumption that score usage should necessarily equalize outcomes for individuals with the same scores. Policy changes that are subject to judicial discretion may not be equally adopted across geographies.15 Moreover, even within judge-time, there is suggestive evidence that moderate risk levels may interact with race to produce different judicial decisions.
Mechanism Discussion
On Judges and Geography
There is a striking correlation between a judge’s response to the policy and a judge’s defendant population. The below graph displays each judge as a dot whose placement indicates the judge’s pre-/post-HB463 rates of non-financial bond and whose color indicates the fraction of that judge’s defendants who are black. Most dots are above the 45 degree (red dashed) line, meaning most judges did increase their rates of non-financial bond. However, it is clear that the yellow-er dots are closer to the red line than are the blue-er dots. In other words, the judges with whiter populations responded more dramatically to the policy change.
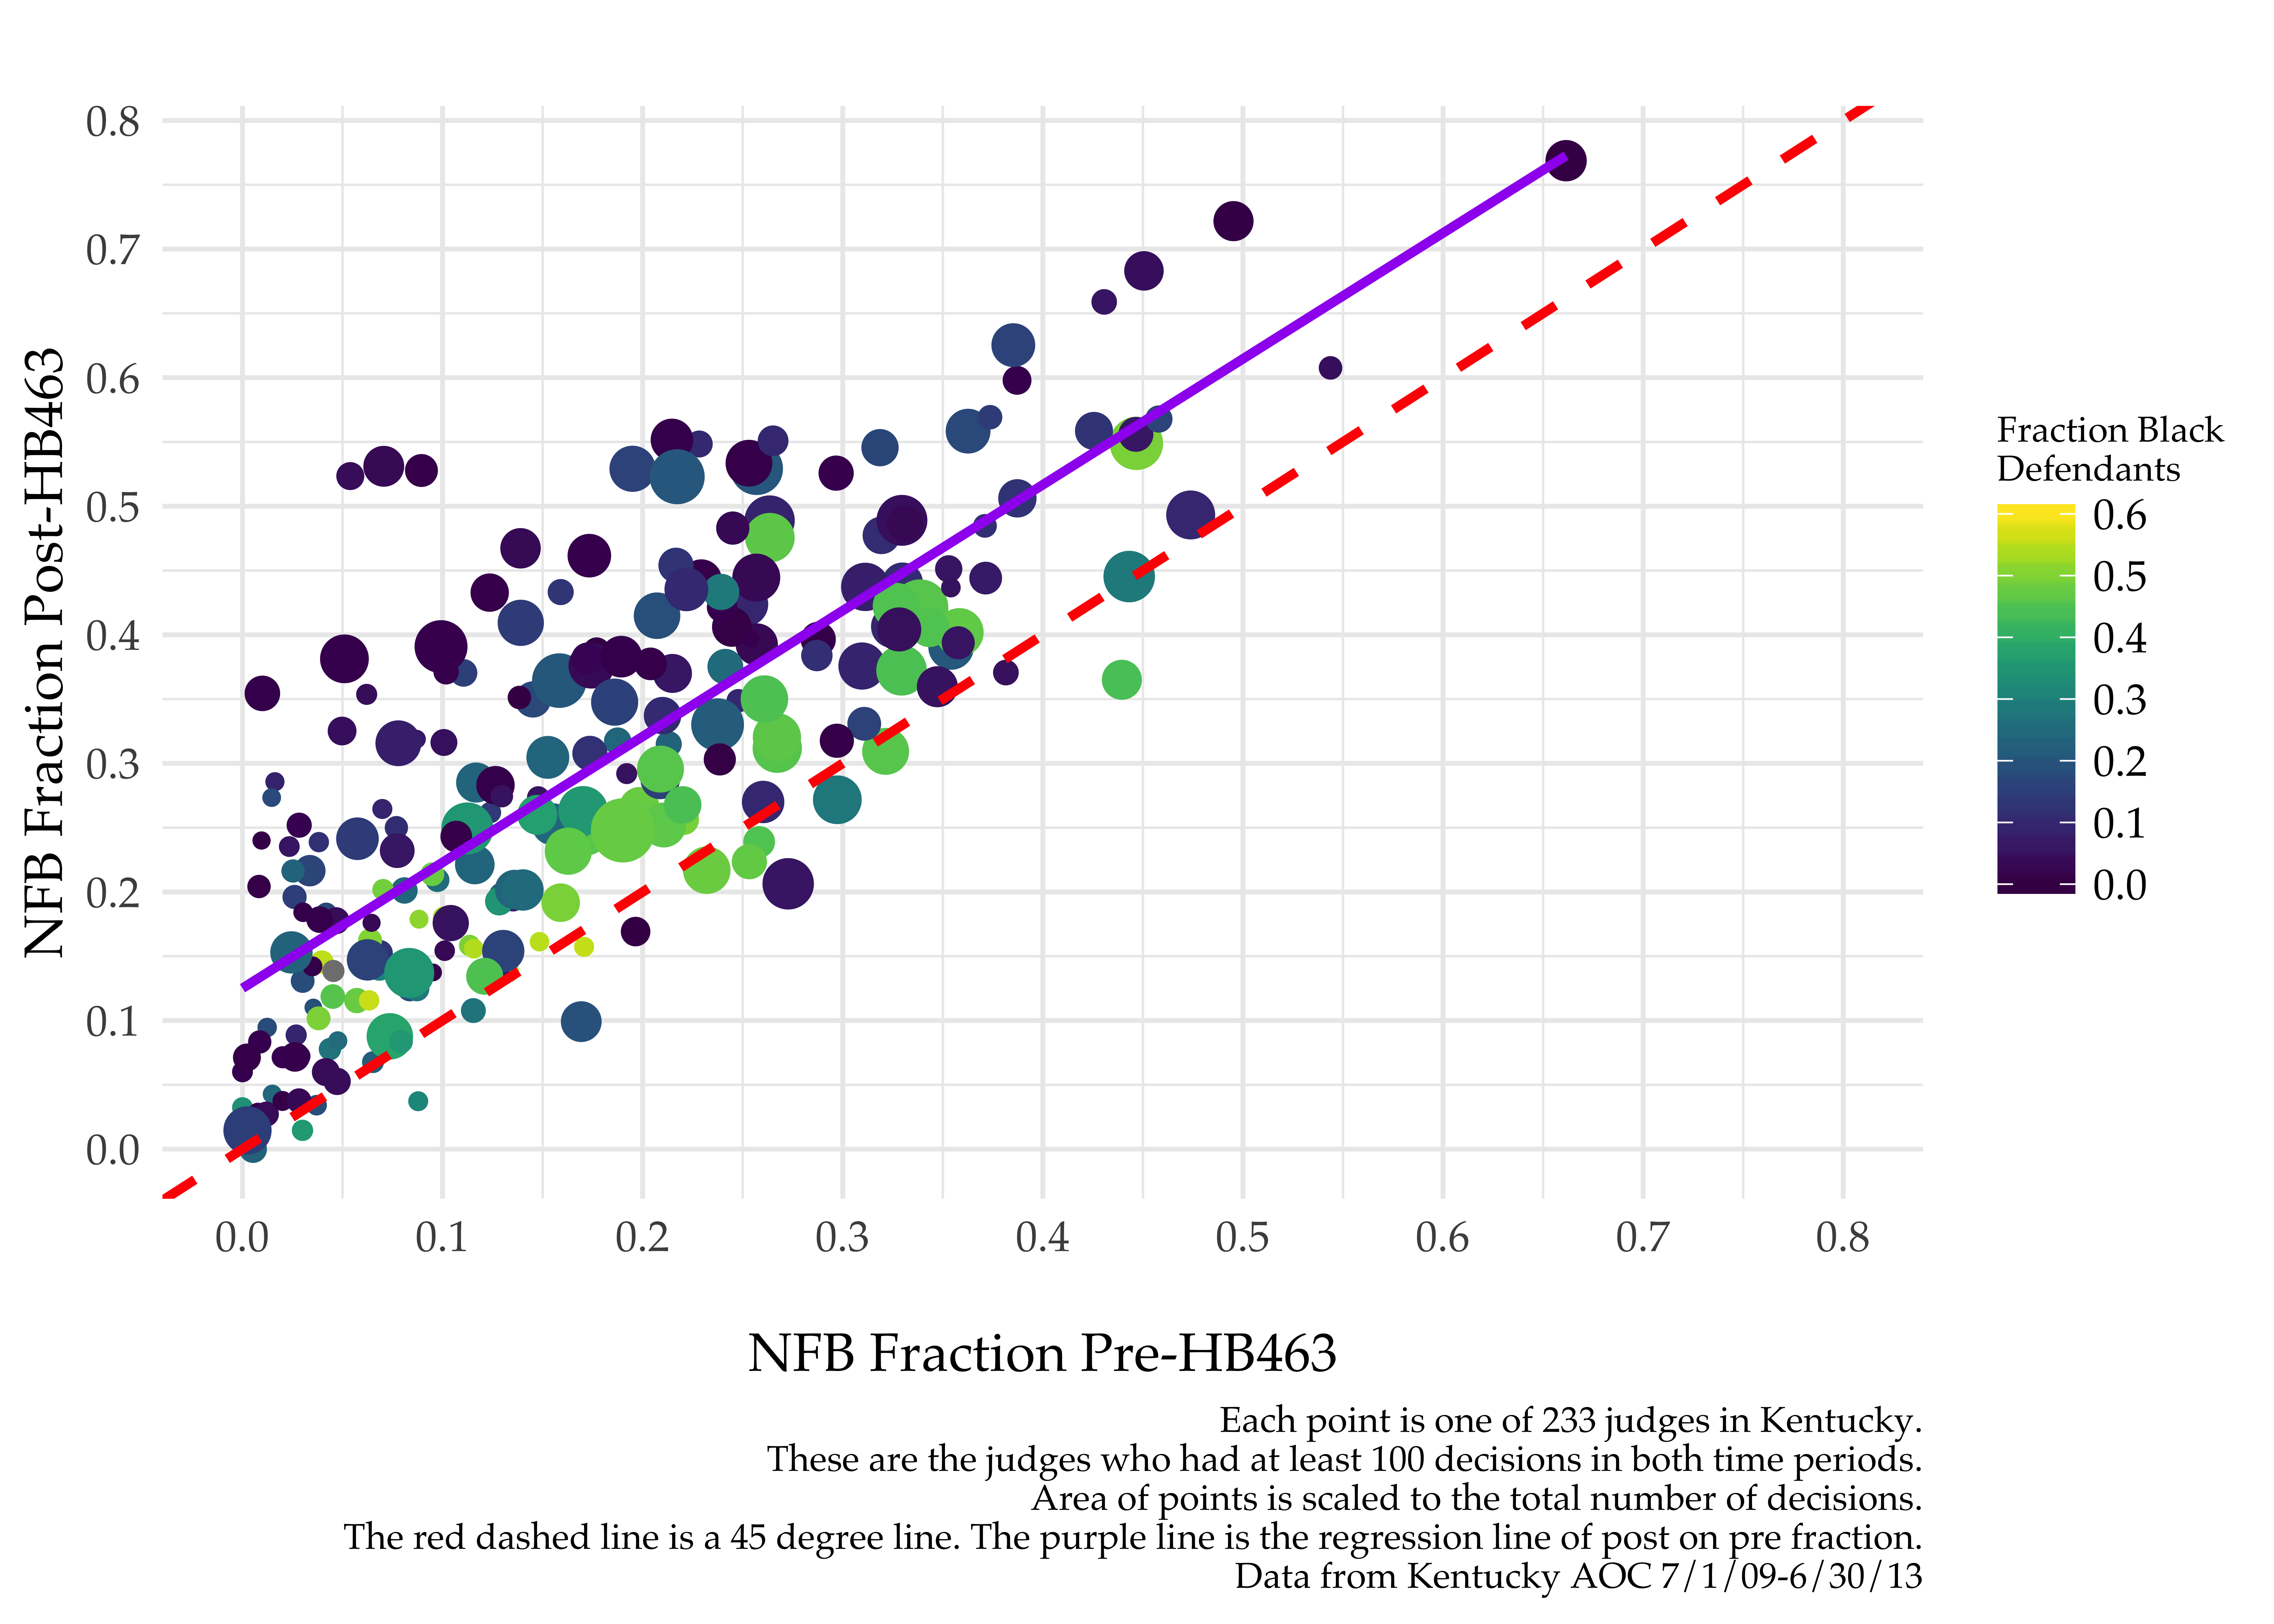
Why would this be the case? Given that judges aren’t randomly assigned to counties (they run for election in various counties), I have two working hypotheses:
- judicial experience
- Larger counties in KY are a higher percentage black. If it is more prestigious to work there, more experienced judges might get those roles. If experienced judges are less likely to respond to policy changes, this could lead to the observed result.
- pretrial misconduct rates
- Judges who have made previous bail decisions resulting in higher pretrial misconduct rates might be less likely to respond strongly to the policy change. If misconduct rates are higher for judges with higher percentages of black defendants, this could lead to the observed result.
Given the growing set of bail reform policies, it is important to understand why this uneven take-up of policies occurs. Otherwise, similar patterns of judicial take-up could exacerbate racial disparities in other policy contexts.
Remaining Racial Disparities for Moderate Risk Defendants
The moderate risk result could be a product of judges’ interpreting scores differently by race. Imagine judges have some sense of the underlying continuous risk score distribution and assume that moderate risk black men are still higher risk than moderate risk white men even though they are put in the same larger buckets. This could explain the results and would accord well with recent findings by Green and Chen and Skeem, Scurich, and Monahan. Understanding this possible mechanism is broadly relevant to hiring, loan decisions, and other important high-stakes decisions. More work16 is needed to pin this result down.
Conclusion
As predictive tools continue to be integrated into high-stakes decisions, there is a growing need to understand how they are used by the human decision-makers (e.g., judges, loan officers, and hiring managers). While predictive tools often present recommendations, there is little oversight as to how decision-makers may overrule or follow them. I use this paper to show that, counter to expectations, the introduction of risk score recommendations can widen racial disparities for individuals who share the same predicted risk level.
This result is a consequence of two types of deviations by judges: across-judge and within-judge deviations. On the former, judges varied in their policy responsiveness; judges in whiter counties responded more to the new default (increasing their leniency) than judges in blacker counties. There is a striking correlation between a judge’s response to the policy and a judge’s defendant population. Second, even within judge and time, I show judges are more likely to deviate from the recommended default for moderate risk black defendants than for similar moderate risk white defendants. (Importantly, this is true in the post- but not the pre-period.) This result suggests that interaction with the same predictive score may lead to different predictions by race, which warrants further investigation.
Part of the public appeal of risk assessments is the idea that they are a move towards a system that is more “objective” than the status quo. However, if interpretation of the scores themselves interacts with defendant race, the very judicial discretion that risk score proponents sought to reduce has simply been shifted to a later stage.
-
The prevalence of pretrial risk assessments is only increasing with evolving bail reform efforts. Consider Senate Bill 10 in California, which would change “California’s pretrial release system from a money-based system to a risk-based release and detention system.” SB10 is now pending a 2020 referendum. ↩︎
-
While predictive tools in criminal justice vary in their construction and deployment across jurisdictions, most are what we would call “actuarial tools” rather than fancy ML tools. The general idea: weights are assigned to individual features and then summed to form some aggregate score. The original weights were often derived from a regression on a preexisting dataset. This Appeal article contains a useful primer on the subject. ↩︎
-
Bias-related concerns strike a cord given the well-known reality that minorities are disproportionately represented into the criminal justice system. ↩︎
-
Consider The Pretrial Integrity and Safety Act introduced by Kamala Harris and Rand Paul. ↩︎
-
For reading on conflicting definitions of fairness, see this WaPo article. ↩︎
-
Since I began writing this paper, the literature on both these dimensions has massively evolved. As such, I highly recommend reading my full paper introduction if you’d like more reading material references – I reference a ton of work on these topics. ↩︎
-
Bail decisions determine conditions for release from jail before trial. Conditions can include supervision or specific caveats such as no drinking, however, the most well-known conditions are monetary. Receiving financial bond means that a defendant needs to provide some amount of money in order to be released from jail, while non-financial bond means that the defendant does not. ↩︎
-
See p.11 of the paper for exactly how KPRA scores were calculated. ↩︎
-
In practice, this was a small cost – judges simply had to give Pretrial Officers a reason, which could be a few words. ↩︎
-
While I usually share all data associated with my projects, this one is under a Data Use Agreement so I can’t share the underlying raw data. However, I do plan to share my code eventually so people can replicate if they acquire their own Data Agreements. ↩︎
-
More descriptive statistics: 79.1% of defendants are white, while 20.6% are black. 79.5% of relevant top charges are misdemeanors. 68.3% receive financial bond, 27.8% receive non-financial bond, and 3.9% receive no bond. ↩︎
-
There is still a surprising amount of deviation considering that the recommendation was non-financial bond in about 90% of cases. ↩︎
-
The distributions are substantially more similar across races than in the case of, say, COMPAS. ↩︎
-
The judge information set attempts to approximate for all possible observable information to the judges about a defendant and the offense. ↩︎
-
If responsiveness is correlated with demographic features of the population, risk score policies which intend to render more similar decisions across races but within risk scores may do the opposite. ↩︎
-
E.g., more rigorous legitimization of differences-in-differences assumptions. ↩︎