Breaking News
As of 7-14-20 ~3:10pm ET via the Harvard Crimson:1
Breaking: The government has agreed to rescind DHS and ICE rules barring international students attending online universities from staying in the U.S., per a hearing this afternoon in Harvard and MIT’s lawsuit against the agencies.
More important info in this thread, including this point: “DHS is likely going to try again with some sort of restrictions on “newly enrolling,” international students, but keep those already in the US or already enrolled in schools unaffected. So stay tuned.”
New ICE regulation
On Monday 7-6-2020, the U.S. Immigration and Customs Enforcement (ICE) said international students will have to leave the United States if their schools are not offering in-person classes in the Fall. Harvard and MIT are suing the Trump administration over this policy. The US District Court will be considering a preliminary injunction and temporary restraining order on enforcing the ICE regulation today (7-14-20) at 3pm ET.2
This regulation is horrifying in its intent (and brazen lack of concern for well-being)3 as well as its potential scale – there are about 1 million international students studying in the US every year.4 International students are not only a crucial part of our academic student communities – in some cases, they are actually most of the academic student community! In my discipline of economics, for instance, 60% of doctoral degree earners are temporary residents (those on student visas) rather than US citizens or permanent residents. To implement this regulation is to cruelly and illegally disrupt the majority of our peers’ lives.5
After the ICE announcement last week, I decided to use NSF data to illustrate the size of the international student population across doctoral science + engineering disciplines.6 My overarching goal in doing so is to illustrate the enormous impact the ICE regulation would have across doctoral science and engineering communities. While international students make up 5.5% of the total U.S. higher education population7, NSF data shows international students make up 38% of doctoral degrees earned in science and engineering (using the NSF definitions + data, 2006-2016). When it comes to engineering fields, computer science, and economics, international students are consistently the majority of the doctoral student populations.
International students in science and engineering
I recalled from a 2015 project that the NSF posts data on doctoral degree earners by citizenship, race, and ethnicity. The most recent data covers 2006-2016 and is available as table 7-4 here. When the NSF says citizenship, they use the categories of “temporary resident” or “US citizen or permanent resident”. If the difference between these definitions isn’t well known to you, you are probably (like me) in the US citizen category and thus (in a state of blissful ignorance) you don’t have to know all the different definitions. Permanent residents are those with green cards, while temporary residents are those on student visas.8 The ICE regulations thus impact students who fall into the temporary resident category – I also refer to this group of students as international students. [Please do email me if there’s an issue with the temporary resident/international language – happy to update and learn more about how to be precise and accurate with these terms.]
According to NSF data, 27% of all doctoral degree earners (2006-2016) were temporary residents. When it comes to science and engineering, this percentage increases to 38%. (For economics, in particular, it’s 60%.) These are huge figures, especially in comparison to the broadest statistic when it comes to higher education – 5.5% of all students in the US higher education population are international. Clearly, international students make up a much larger percentage of the student population at the doctoral level than at the undergraduate level.9
Variation by discipline
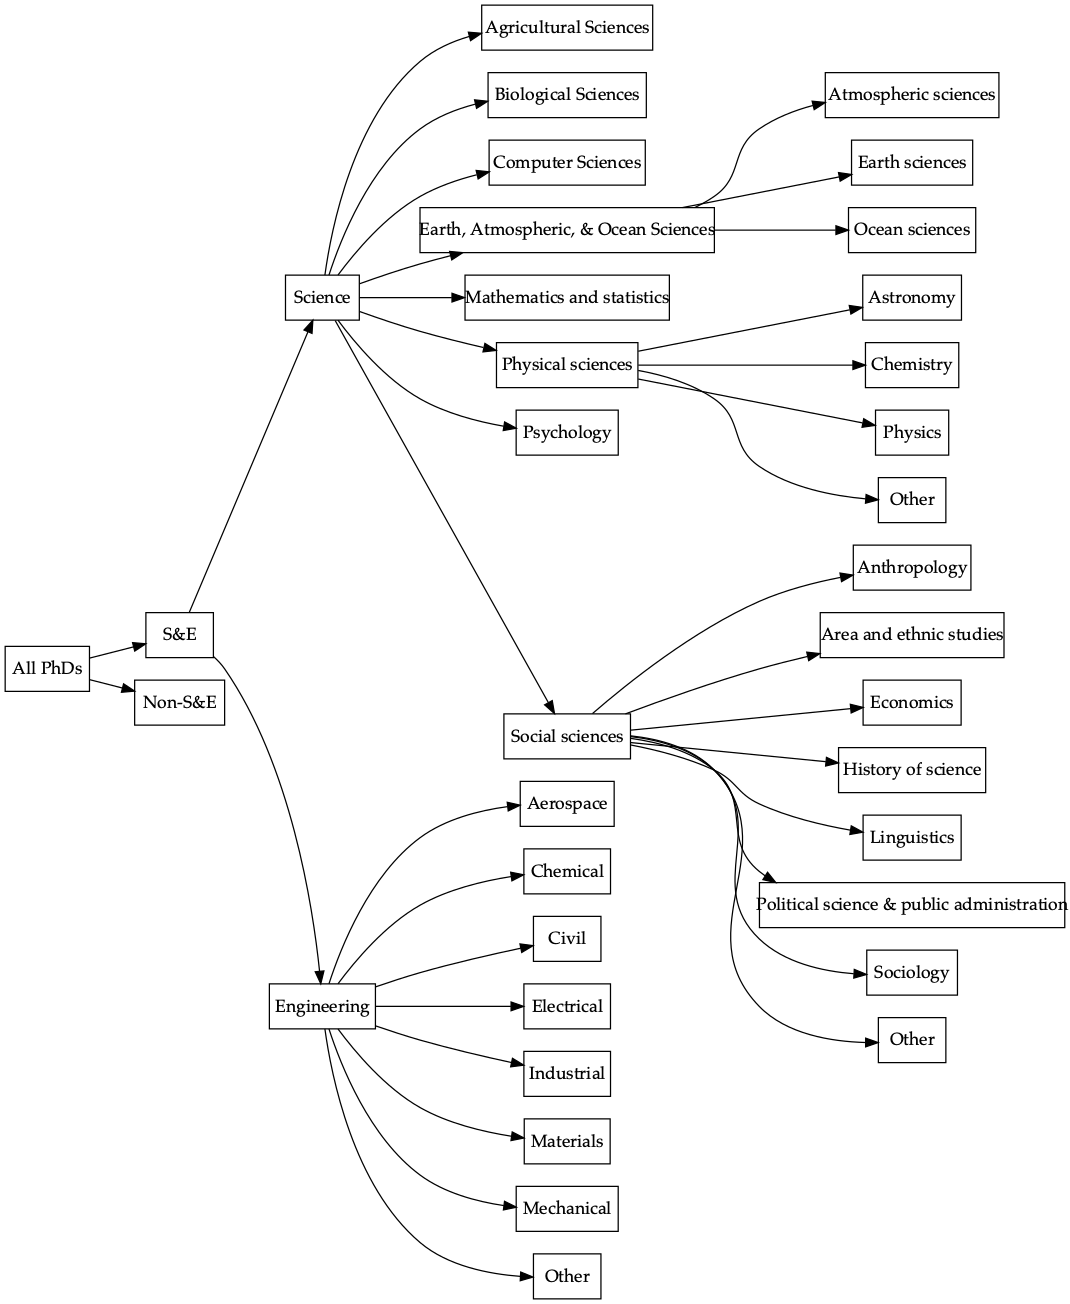
Science and engineering in the NSF definition includes disciplines ranging from social sciences like anthropology to engineering fields like aerospace engineering. As such, it’s worth looking at doctoral student populations by more specific fields. I use the flowchart below to show how the NSF categorizes disciplines for context. When I discuss fields, I use the most specific field the NSF provides rather than groupings like “social science” or “engineering”.
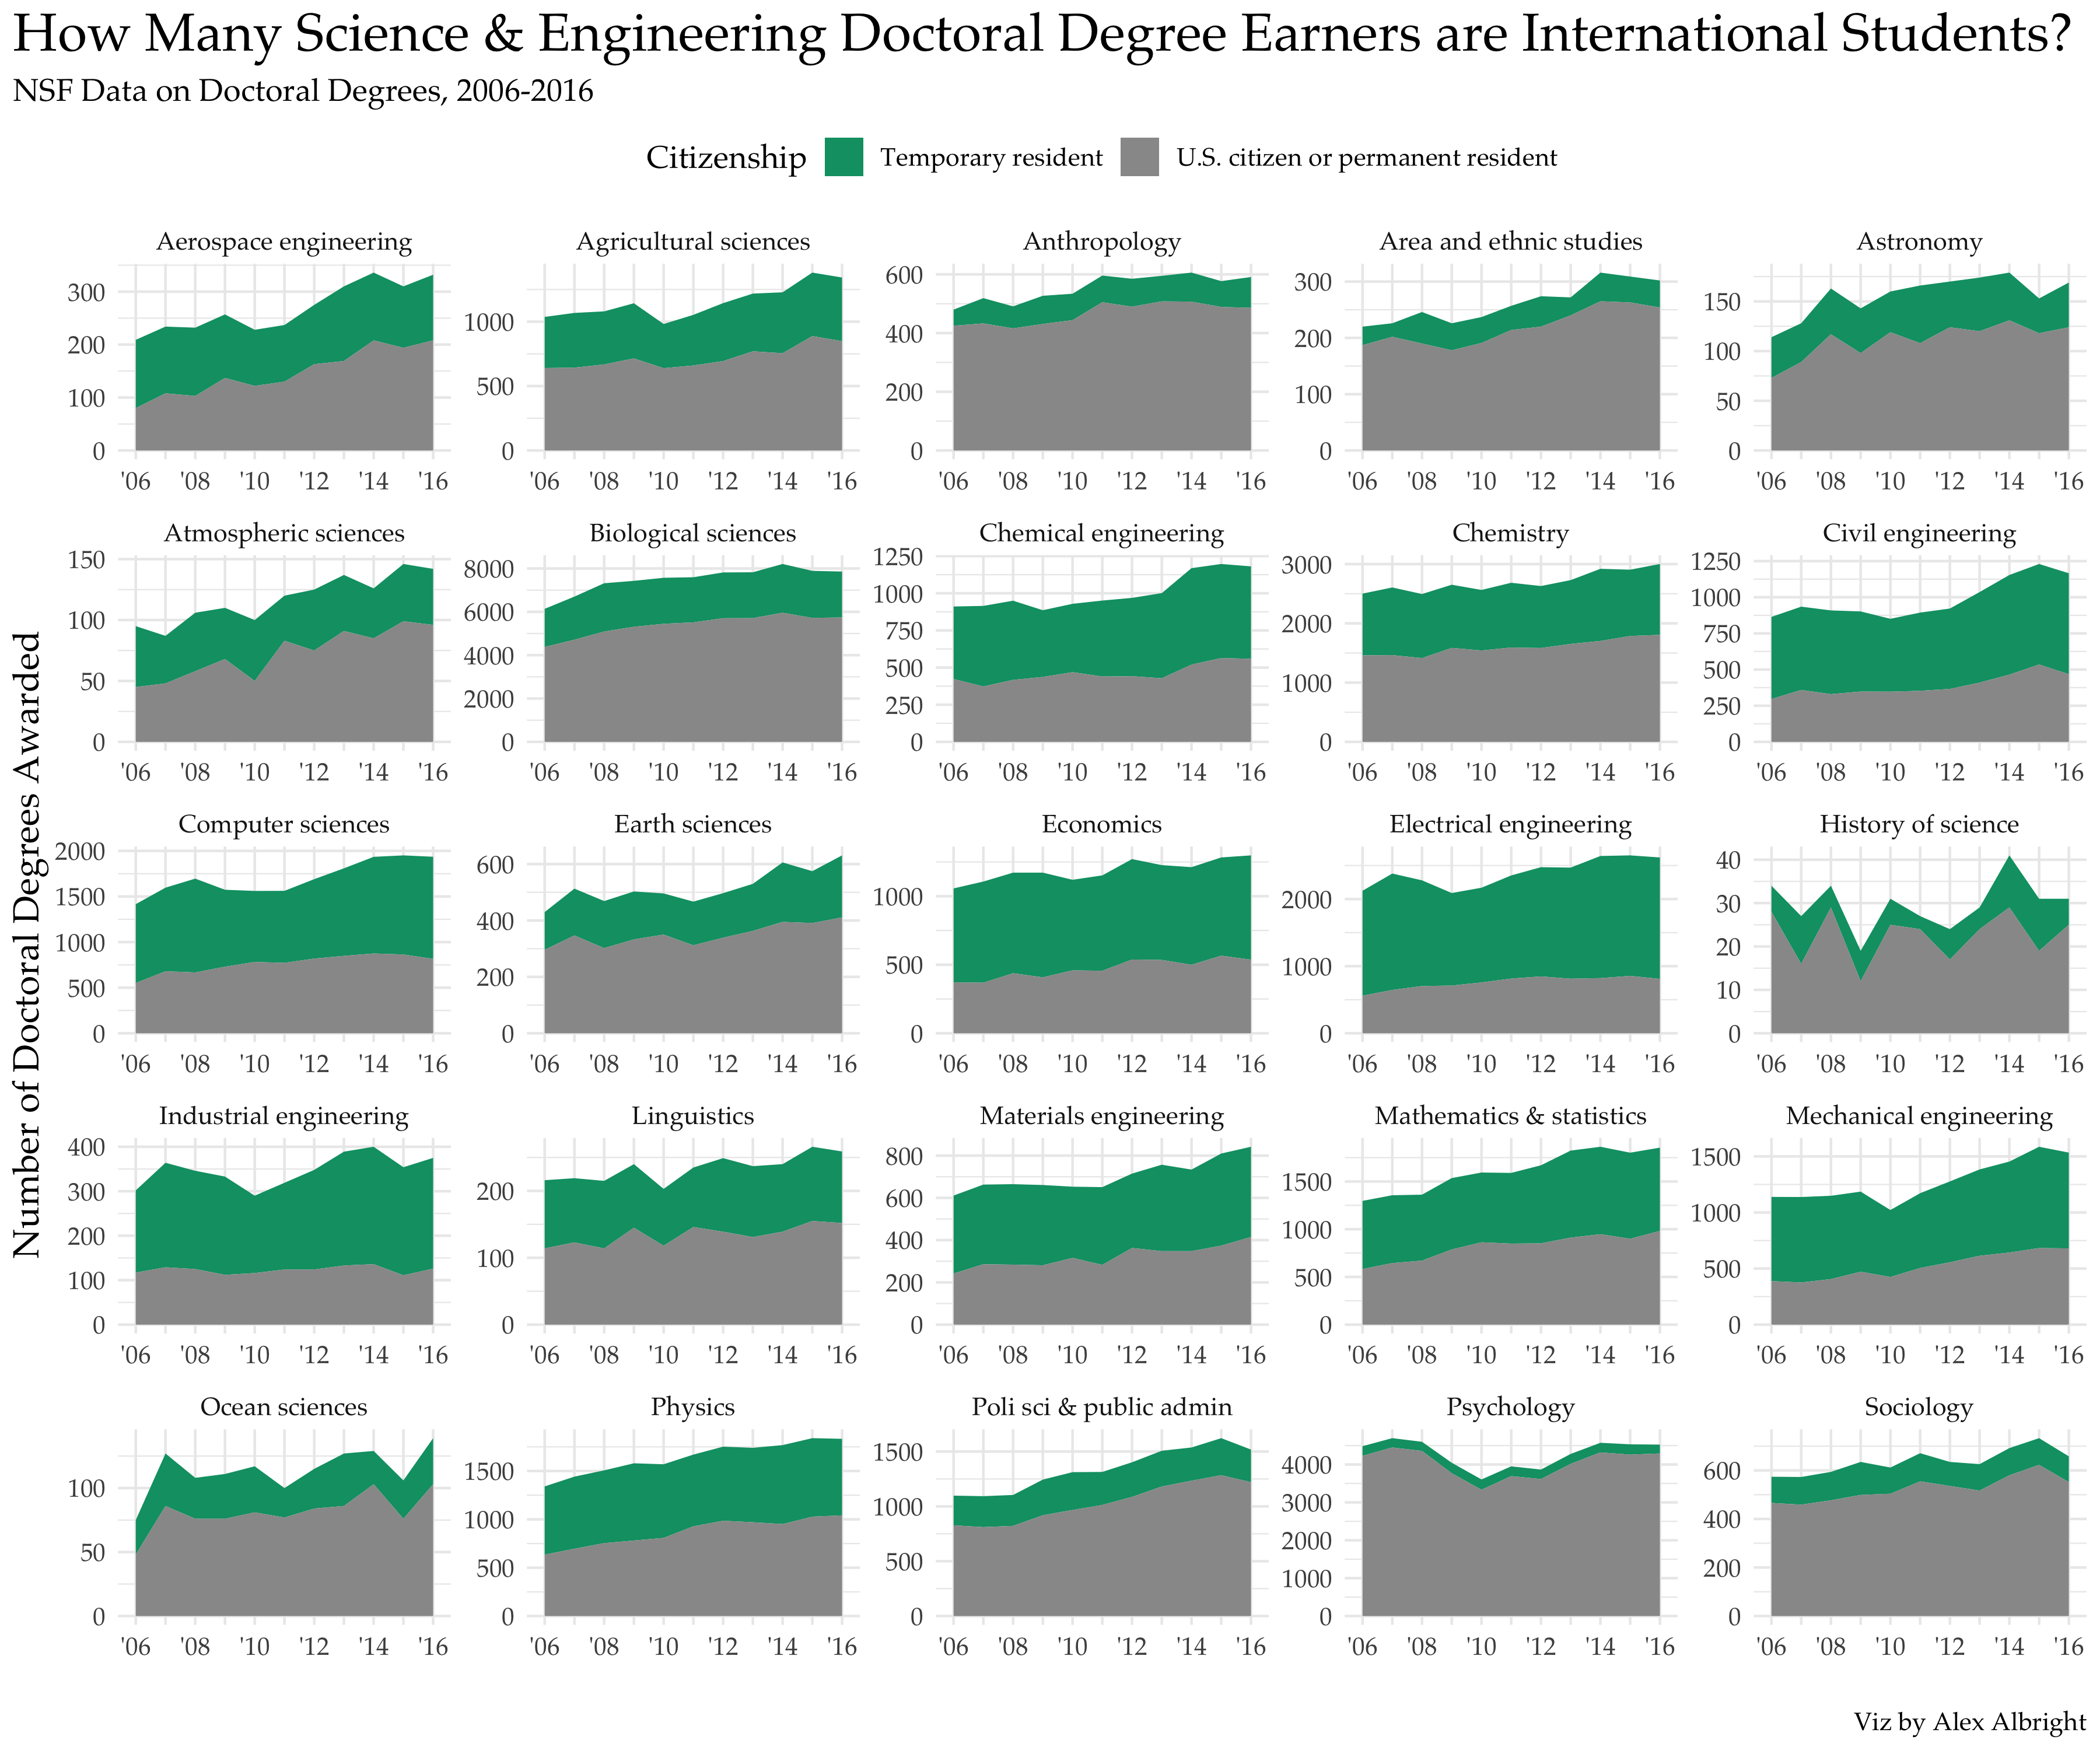
First things first, I show the total number of doctoral degrees awarded 2006-2016 by discipline. I then color by the NSF citizenship category.10
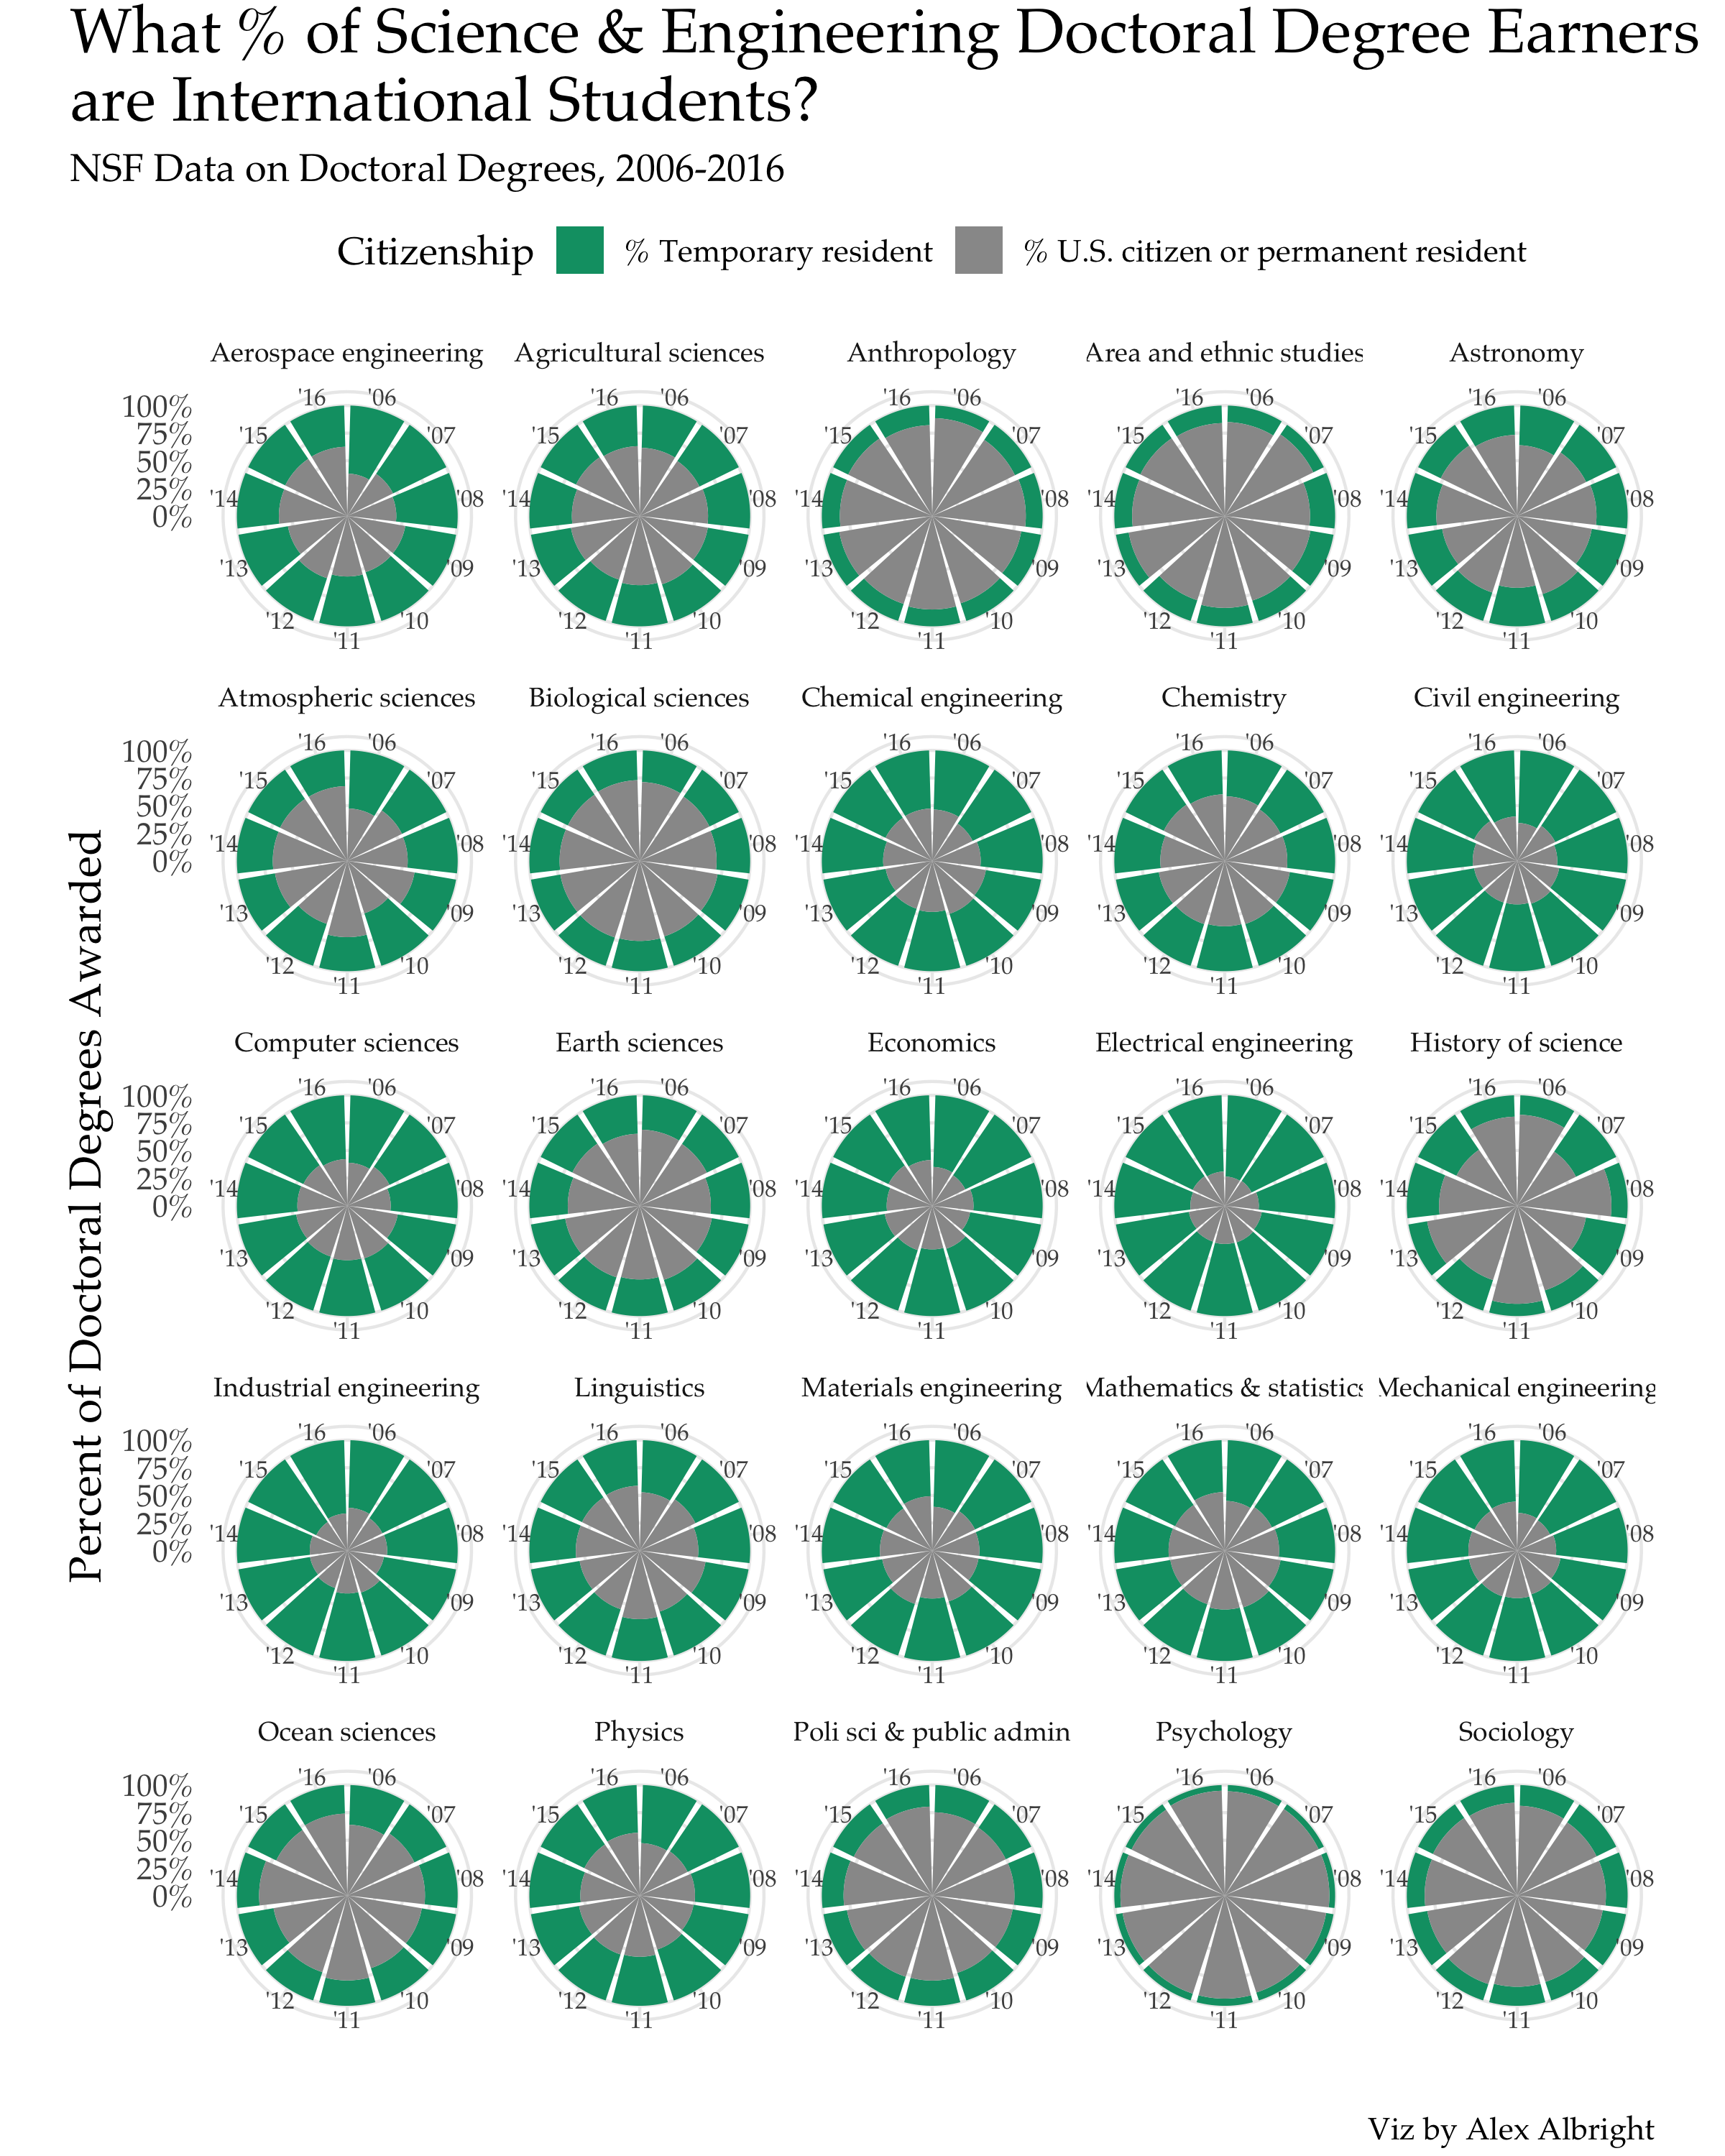
While the above shows the count of doctoral degree earners, another figure of interest is the percentage of each discipline’s population that is international. I show these percentages over 2006-2016 using the below nightingale plot.11
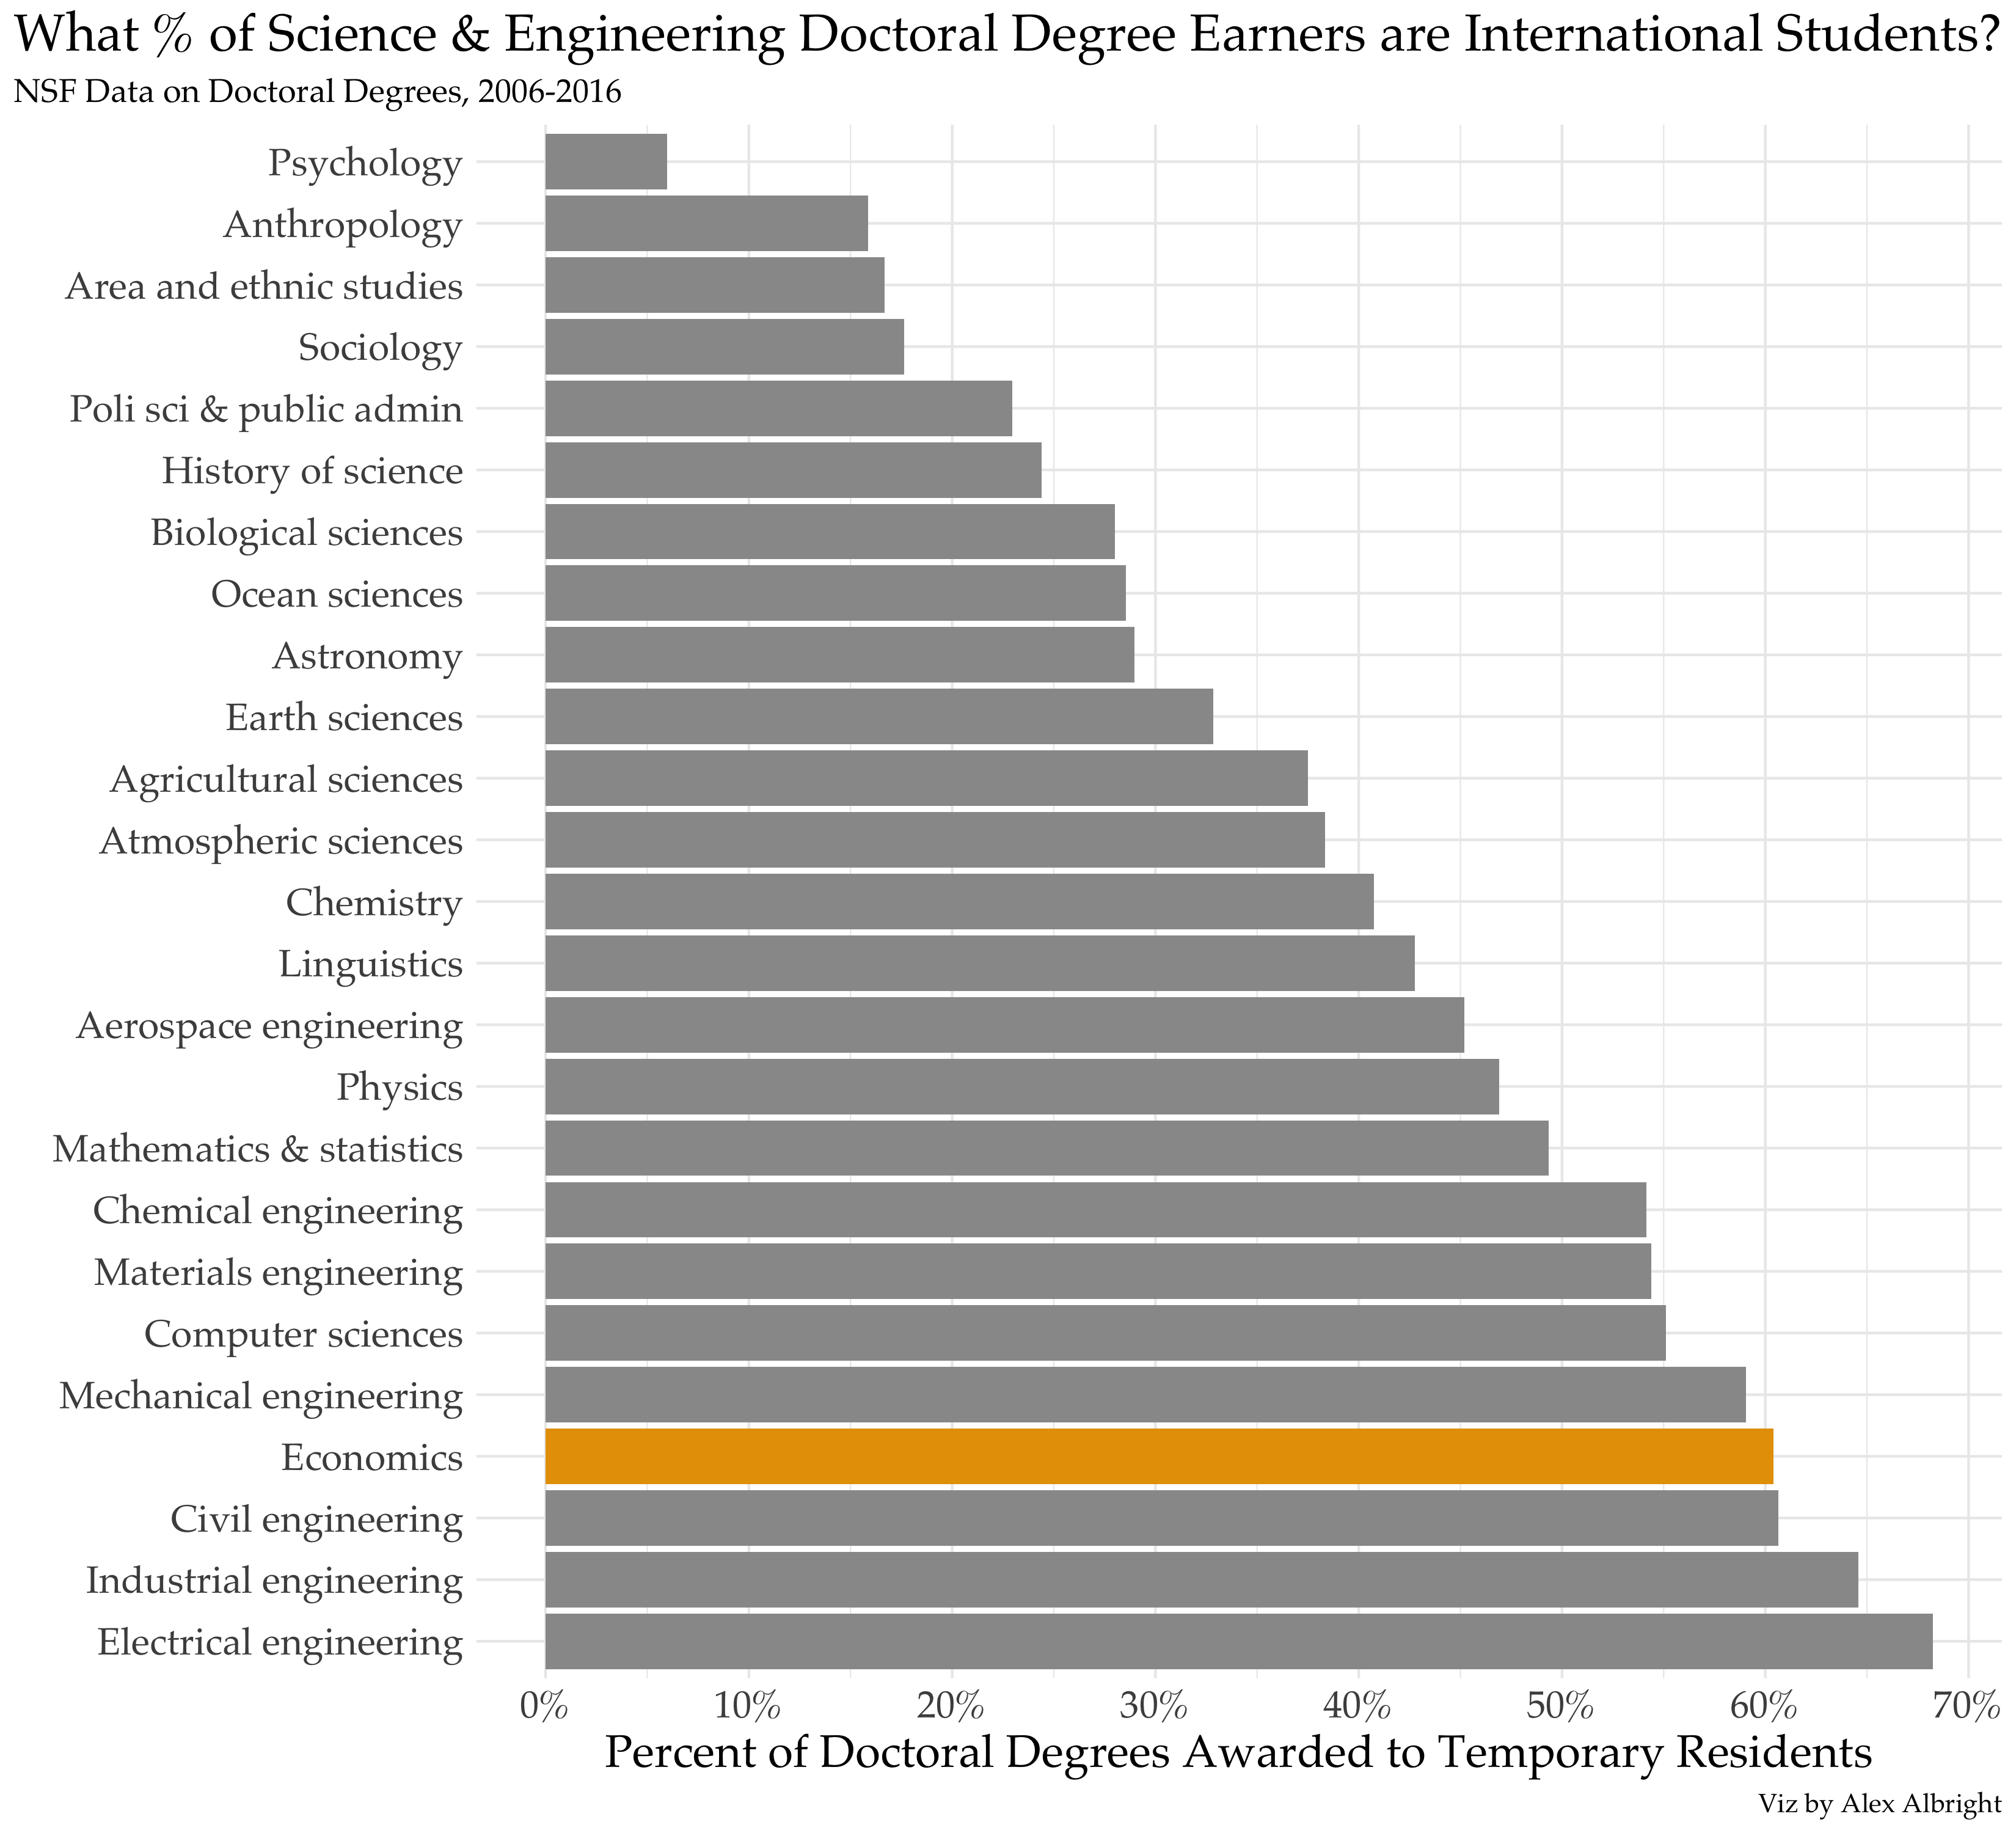
While the two above plots show counts and percentages for each of years 2006-2016 separately, the trends over time aren’t of great importance to my overarching goal for this post. So, I also simply calculate the percentage of doctoral degree earners that are international across all years 2006-2016. Those stats are represented by a simple bar plot below. I color economics orange for emphasis since that’s my academic community. All engineering fields except for aerospace have a majority international doctoral student population. Computer science and economics also have majority international doctoral student populations.
Of course, the fact that less than 10% of doctoral degree earners in psychology are international doesn’t mean that ICE’s regulation isn’t vitally important to the doctoral psychology community. Affronts to the safety and humanity of even small percentage of students are always worth fighting. Nevertheless, I hope pointing out the population compositions by discipline aids our understanding of the vast scale of the detrimental impacts of this policy for doctoral communities. I stand in opposition to ICE’s announcement with my peers pursuing doctorates, with HGSU-UAW at the MA State House, and on the phone for today’s 3pm ET hearing.
#MeltICE12
- Want to support international students + oppose ICE’s regulation? Check out the action items here, put together by the Harvard Grad Union!
- Important reading: Martin Aragoneses’ thread on costs to international students here
Data/Code
- The NSF data on doctoral degrees earned by citizenship is available here as table 7-4.
- Here is my R notebook for this post – it manipulates the NSF data into a form that is workable for making graphs and getting summary stats.
- Here is my Github repo.
-
According to this tweet thread, the government rescinded one minute into the hearing. ↩︎
-
The MA AG is suing (as part of a coalition of 18 attorneys) as well. ↩︎
-
From MA AG Healey: “Under normal federal rule-making processes, they actually have to look at the impact of any proposed policy and take comments and consider things. And here, what the Trump administration is doing is essentially forcing colleges and universities to physically reopen their campuses and have students on campus in the midst of a pandemic… this is a sudden, unexplained, drastic shift to the student visa program that not only punishes the 77,000 foreign students who come to Massachusetts for education, but hundreds of thousands of students across this country.” ↩︎
-
The 1 million stat is from this NYTimes article. Other numbers of interest: these students contribute an estimated $41 billion (stat from NAFSA) to $45 billion (stat from IIE) to our economy. ↩︎
-
As Martin Aragoneses points out here, “The press has cited estimates of the financial cost of this change to be $41-45 billion dollars (roughly the GDP of Slovenia). This estimate is likely under measuring the negative effects given that it mostly reflects university tuition + expenses.” Thus far unquantified is “direct harm, including financial strain, to the international students forced to leave and the future negative ramifications this may have for the U.S. economy.” You can help him quantify this by responding to his survey for international students here. ↩︎
-
Doctoral degrees are the highest level of academic degrees. Usually, this means a PhD (Doctor of Philosophy) but there is also the D.Sc. (Doctor of Science) and other degrees in the doctoral category for science and engineering. As such, I just say “doctoral degree” to include all relevant degrees. ↩︎
-
International student visas include: F1 for academic studies, J1 for practical training, and M1 for vocational studies. The F1 is the most common visa type for international student studying in the US. ↩︎
-
The reversal of international student percentages at the undergraduate (low % international) and graduate level (high % international) was written about by the NYTimes back in 2017. ↩︎
-
I do this with a stacked area plot. In ggplot language, I facet by field and fill by citizenship. ↩︎
-
A nightingale plot is really a stacked bar plot that uses just polar coordinates. ↩︎
-
H/t for this phrase: people at the 7-13-20 No #StudentBan Rally & HGSU-UAW’s instagram ↩︎