Writing about economics writing: metaplots + metadata
Throughout the last 5 years of my PhD, I’ve developed a list of questions big and small about economics paper trends and conventions. What places do economists write about the most? Is differences-in-differences bigger than instrumental variables now? How often do economists use colons in their titles? Is it just me or… do economists really like using the verb “exploit”?
As this string of questions has gotten a little unwiedly over time, I’ve been on the look out for a nice public dataset to use to address these questions. A new convention in the motivational slides of applied econometricians/methods folks gave me hope on this front. Graphs (metaplots) that demonstrate the growing prevalence of terms like “administrative data”, “census linking”, and “staggered differences-in-differences” are now familiar figures. Metaplot-makers often need to first make the underlying dataset of academic papers.
The paper “Technology and Big Data Are Changing Economics: Mining Text to Track Methods” by Currie, Kleven, and Zwiers (CKZ 2020) serves as a prominent example. CKZ (2020) create dozens of metaplots to describe the landscape of changes in applied microeconomics methods from 1980 to present. Using data from the “top five” economics journals and the NBER working papers series, they empirically illustrate the credibility revolution (more empirics!), graphical revolution (more graphs!), and a few other coming revolutions in the academic economics universe (ML, text mining).
CKZ (2020) use data on the full text of “top five” and NBER papers, meaning the data includes the body of the paper itself. Due to access restrictions to full text data like this, they are not able to share the raw data. However, metadata is not similarly restricted. The NBER working paper series metadata is public and includes information on titles, abtracts, author names, dates, and more. (See here and here for the raw NBER metadata.)1
Equipped with this metadata, I can make my own figures to answer some of these questions I’ve squirreled away over the last few years… or, to translate into academic economist speak, “I exploit unique large-scale text data from a corpus of economics papers to provide descriptive evidence on, well, a bunch of things.”
Since I’ll be pulling from a grab bag of questions, don’t expect incredibly smooth transitio–
Methods: good times for data and diff-in-diff
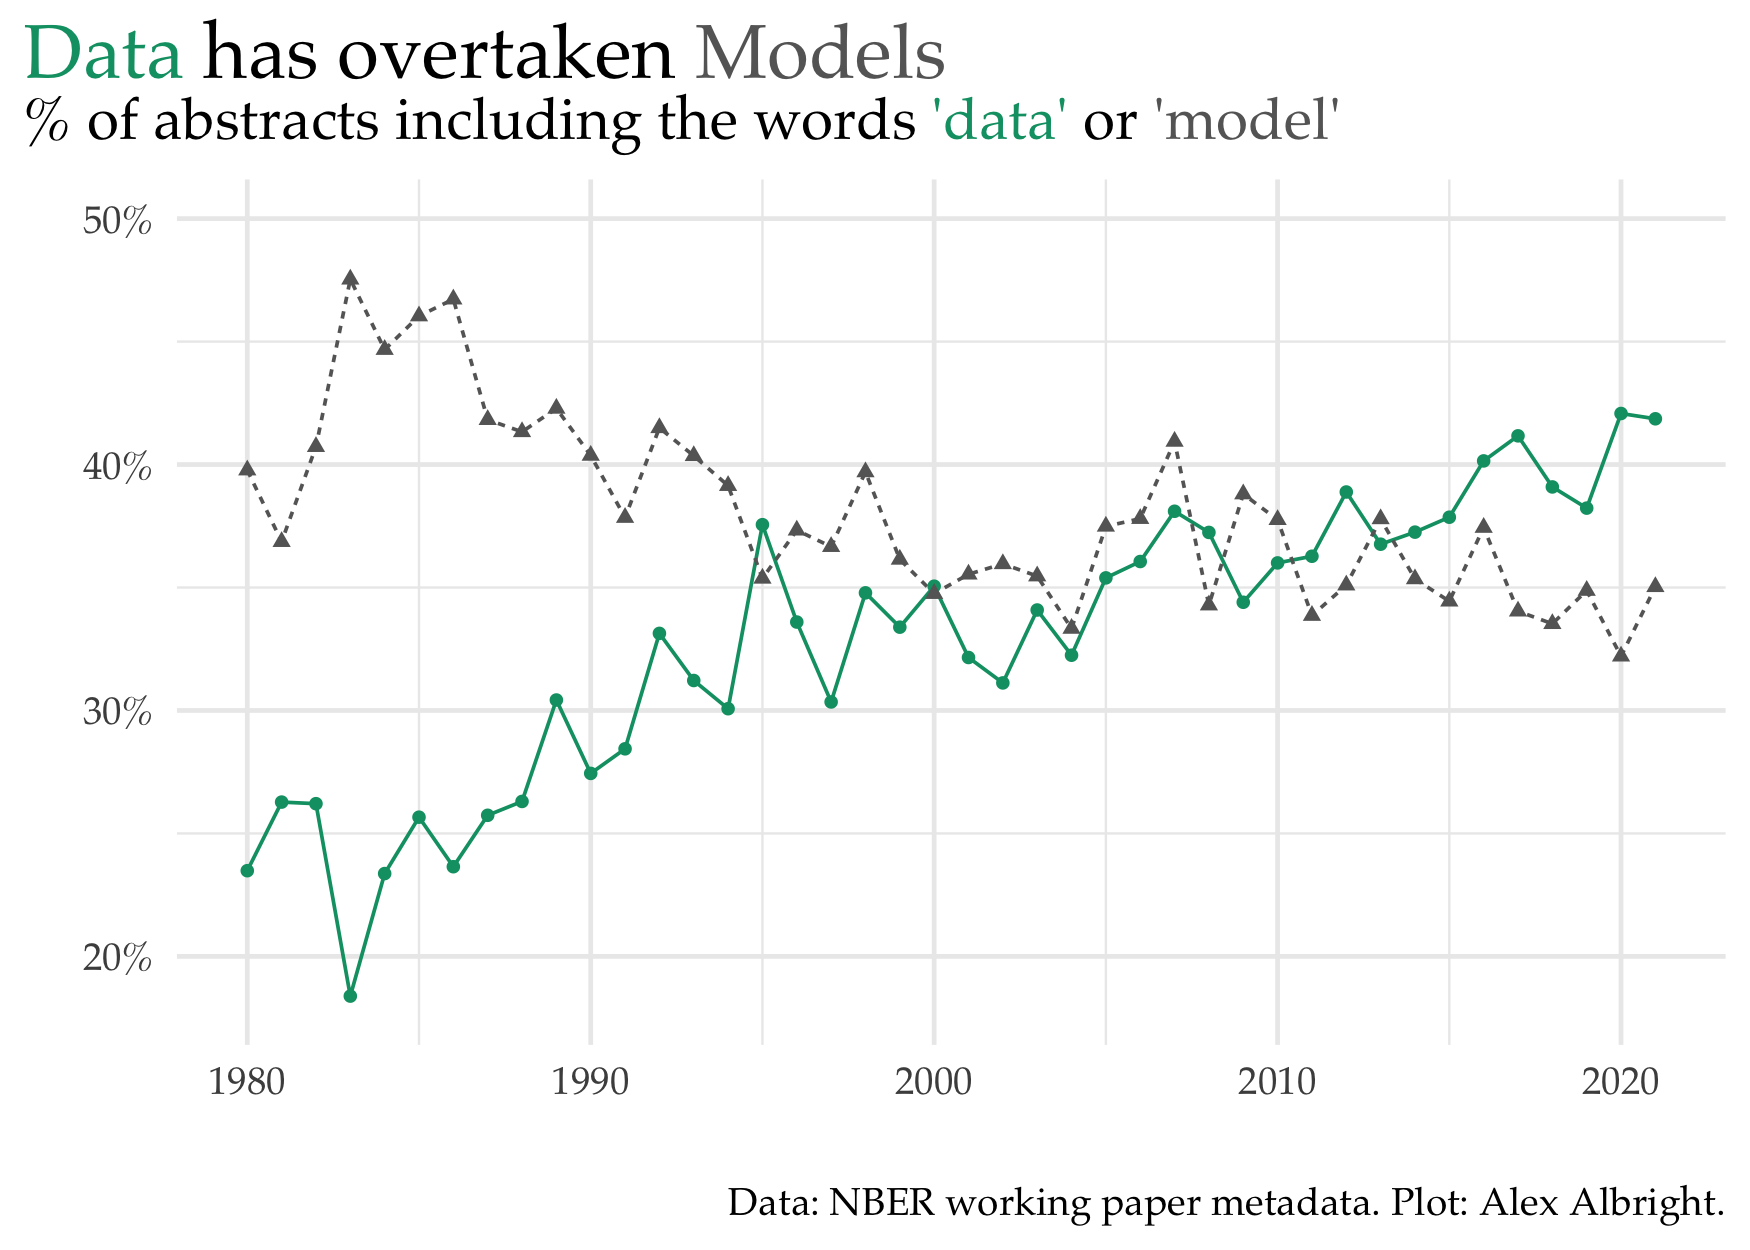
Two of the most common words used in the NBER abstracts are, unsurprisingly, “data” and “model”. Another way to visualize the “credibility revolution” that CKZ (2020) discuss is to compare the changes in the usage of these terms. “Data” has been showing up “model” every year since 2013. 2020 is a very different picture than 1980, when “model” was more than 15 percentage points higher in abstract representation than “data”.
One fascinating and intriguing element of CKZ (2020) is the different trends in quasi-experimental techniques.2 While they show diff-in-diff (DD) at 23% and IV at 30% in 2020, the picture looks different if I perform a similar exercise with the abstracts data. I plot the % of abstracts the feature words related to diff-in-diff (DD), regression discontinuity (RD), or instrumental variables (IV).3
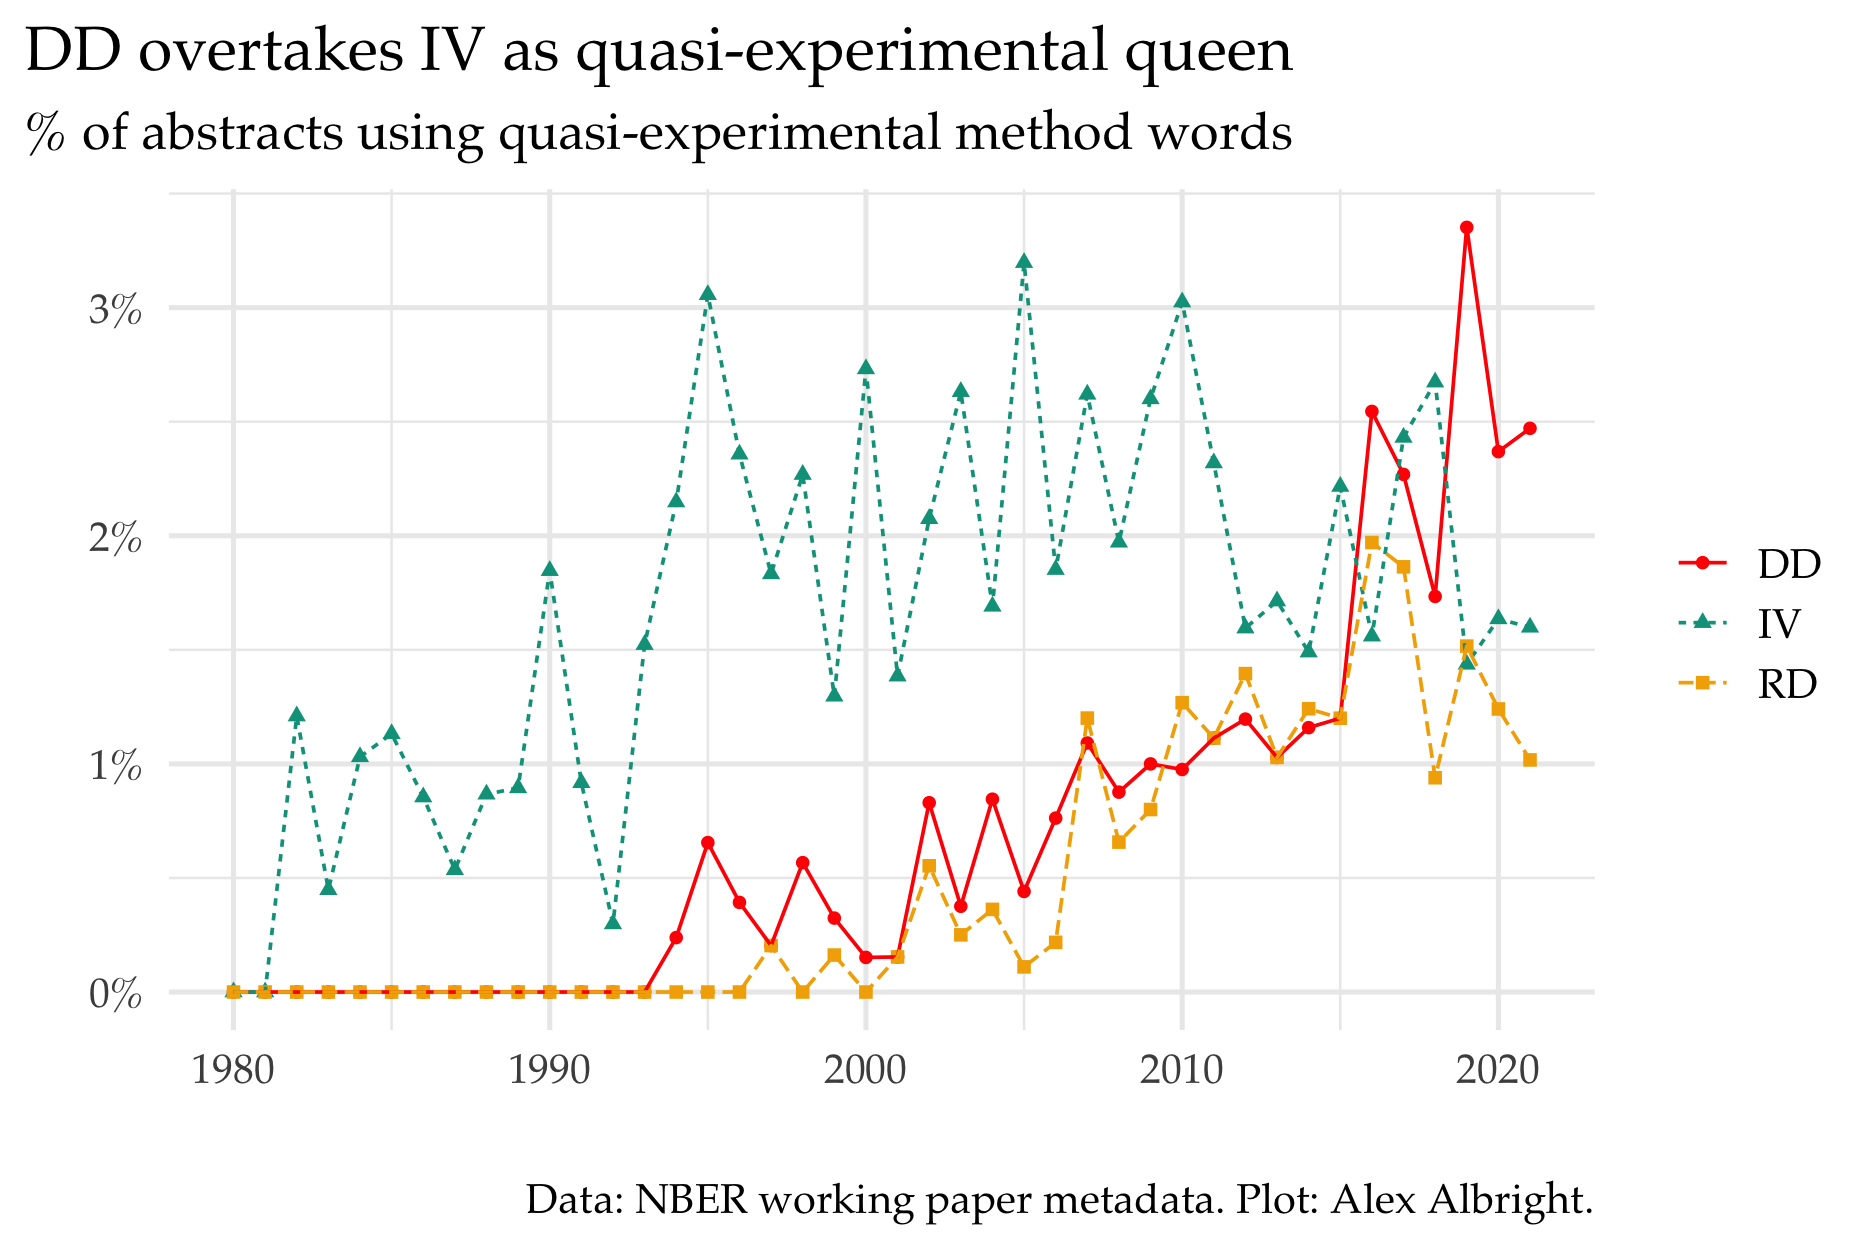
It wasn’t until the mid-1990’s that DD or RD made their premiere on the scene of NBER abstracts. IV remained queen until 2016, when DD jumped ahead for the first time. Step aside IV guys.
Of course, the percentages here are much smaller than in the CKZ (2020) context since I can only observe abstract text rather than full text. The low percentages here are unsurprising given the common convention in applied micro abstracts to discuss what “variation” you’ll “exploit” rather than exacly which quasi-experimental method you’ll use. (More on “exploit” up next.) I know I use DD in my job market paper but don’t mention DD anywhere in my abstract.4
Regardless of whether we are using full text or just abstracts, both approaches demonstrate a plateau-ing of IV relative to an increasingly dominant DD.
Deep cuts: some small things about economics papers
“Exploit”
One surprising word that I see a lot in economics papers is “exploit”. Economists seem to love to write that they exploited something for the sake of their paper. I find this strange since… doesn’t “exploit” have pretty negative connotations? Of course, it’s worth explaining how the term is generally used in economics papers. The below plot on common word pairings5 demonstrates that economists are usually exploiting:
- variation (often, plausibly exogenous variation)/random (assignment)/quasi(-experiments)/natural (experiments)/changes (in policy)
- new/large/unique (data)
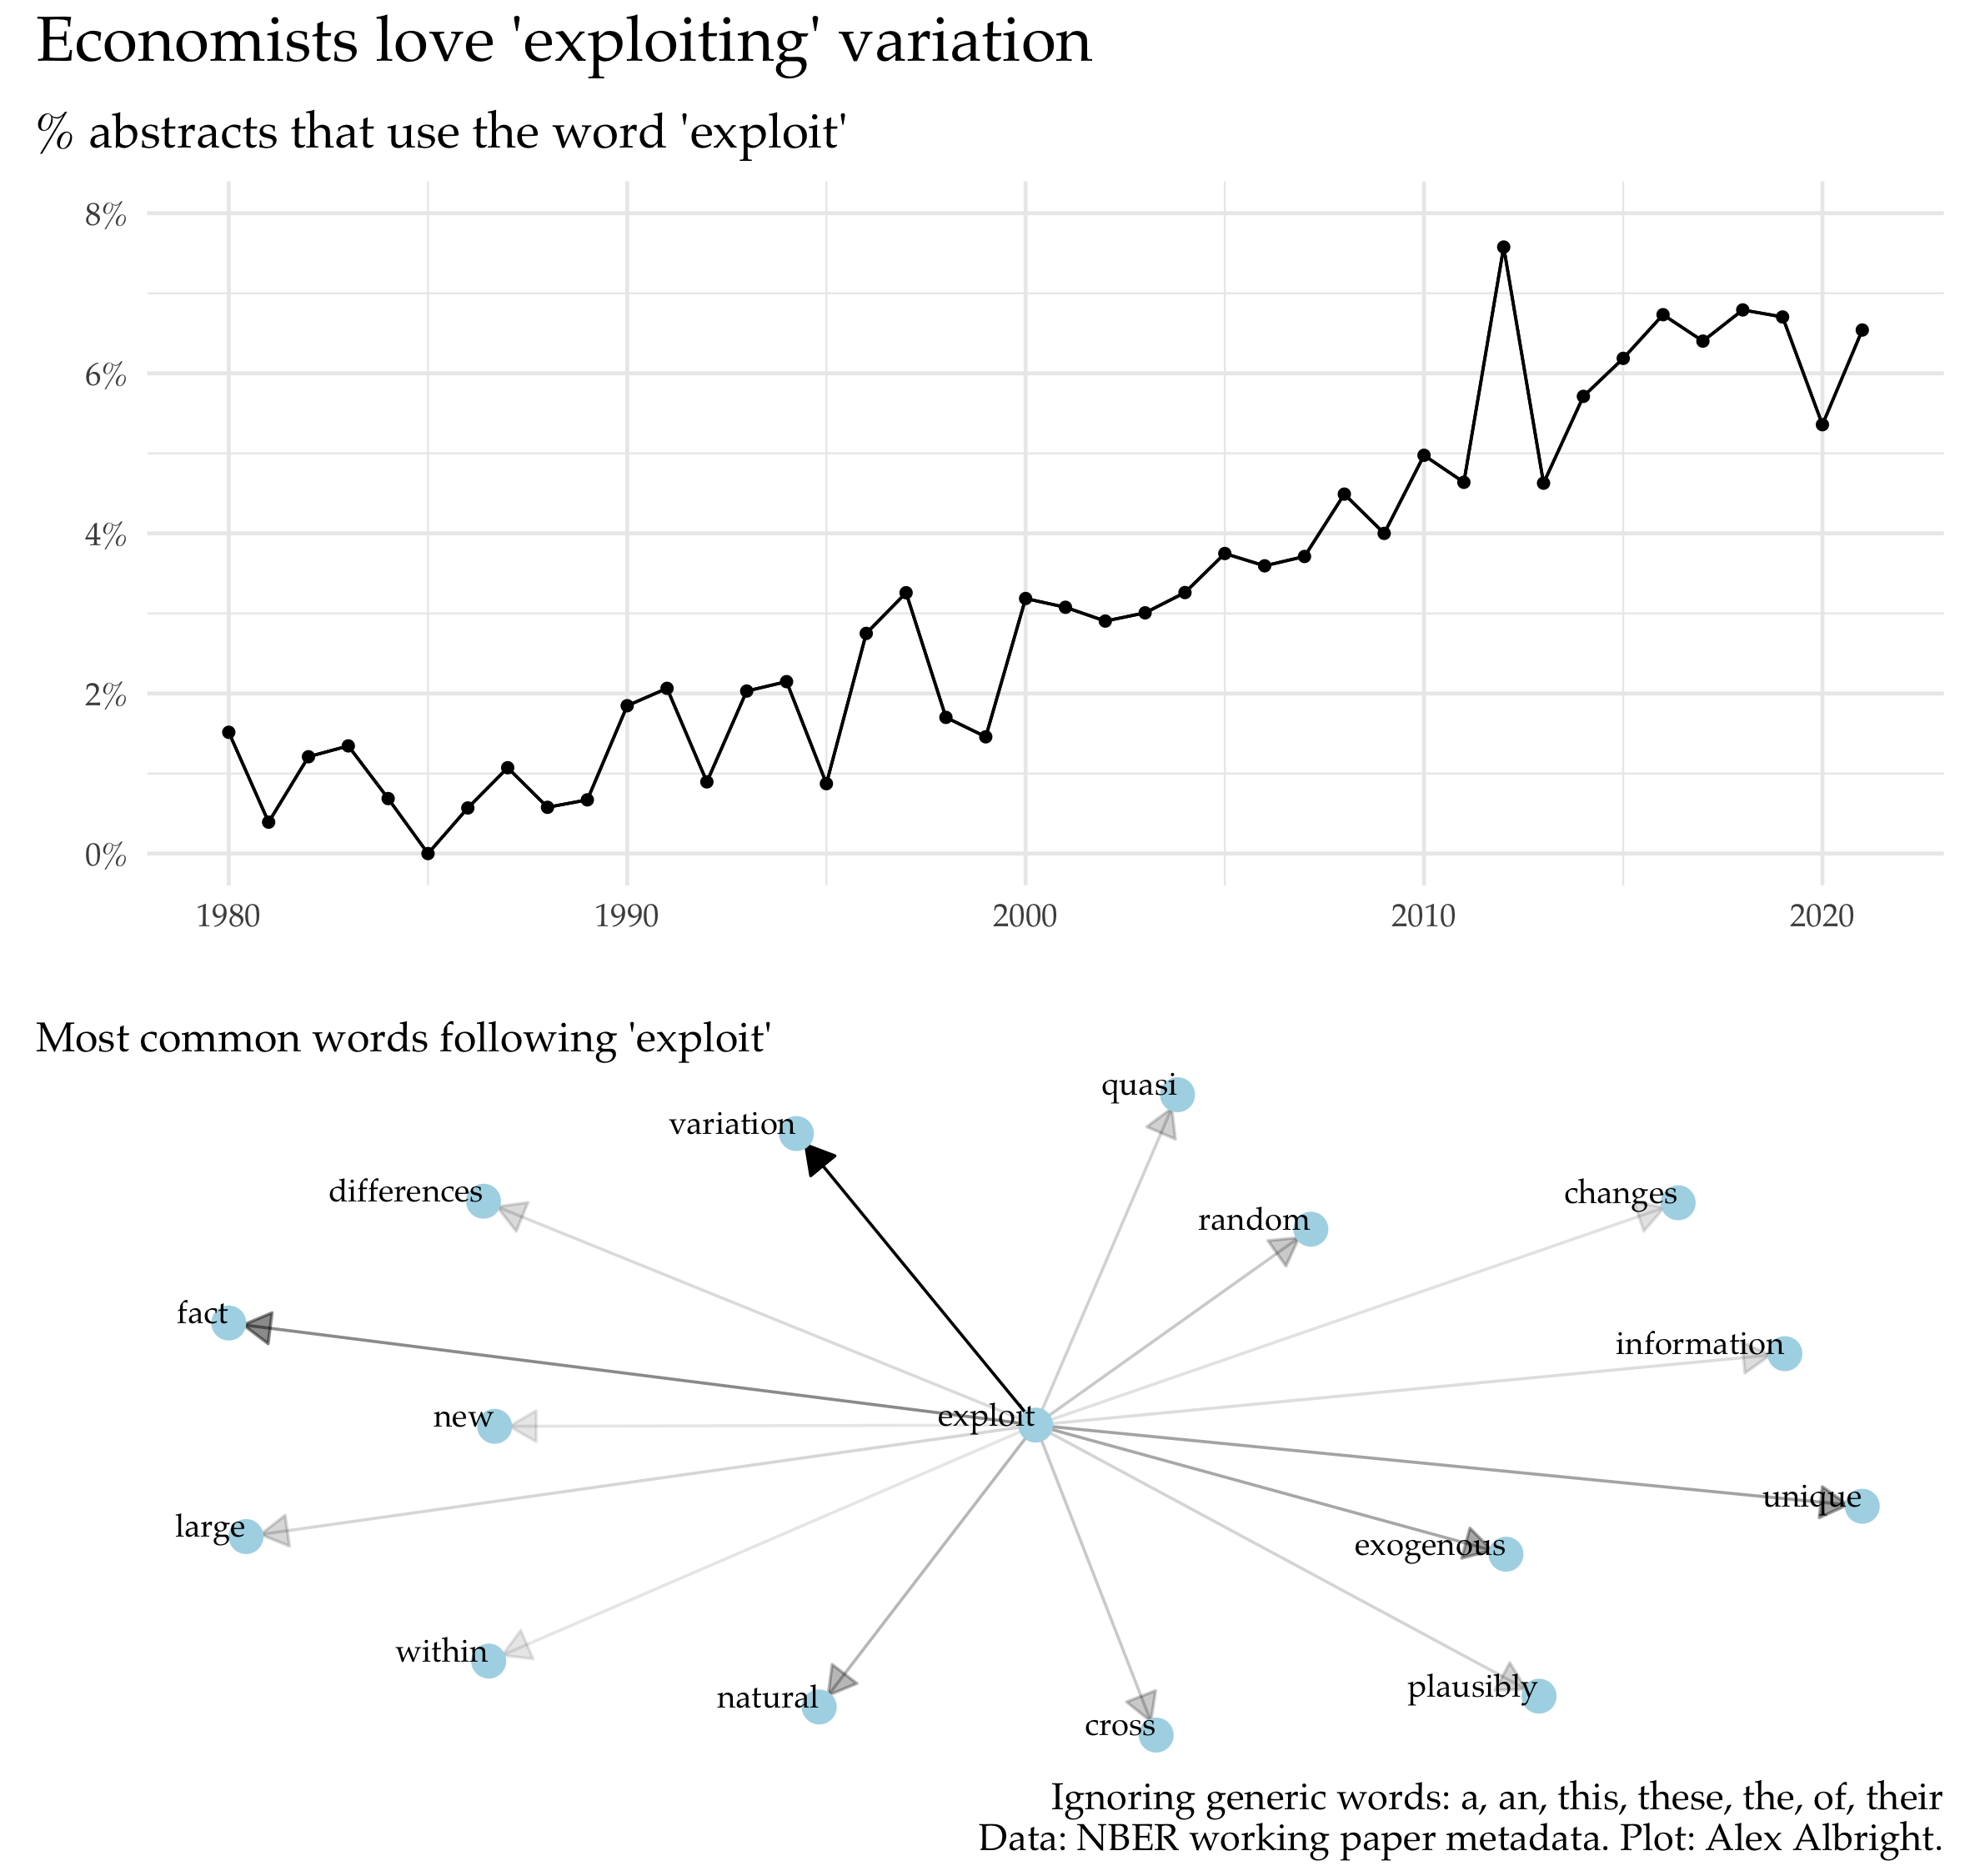
The plot shows that “exploit” has become more popular over time. Its increased usage is likely tied to the discipline’s increased focus on finding settings that are ripe for convincing causal identification (again, the credibility revolution). Authors are “exploiting” variation (from policy changes, natural experiments, etc.) or data (that they might want to flag as particularly useful). They (OK, we) are using it in the sense of “to make productive use of” not “to make use of meanly or unfairly for one’s own advantage”.
In reading a draft of my job market paper, I realize that I now too (after balking at the term dozens of times) naturally write about “exploit[ing] variation”.
The union member in me is thinking that maybe I should switch over to “employ[ing] variation” instead.
Titles
One of the most joked about conventions in academic (economics) papers is the "[Catchy title]: [More detailed info]" title.6 You can use the first part to get in something catchy or cutesy and the second part to remind everyone you are still a serious researcher.
Another title convention is just making it your research question. (The @SayWhaYouFound title school does not like these question or “cliffhanger” titles.) A few authors have even been so bold as to use one-word titles.
It turns out these the 2-part (":") and question ("?") conventions are empirically verifiable. 13% of titles use question marks and 34% use colons. A whopping 45% of NBER WP titles use at least one of the two characters.
| convention | fraction of papers |
|---|---|
| title w/ question | 0.13 |
| title w/ colon | 0.34 |
| title w/ question or colon | 0.45 |
| title w/ question and colon | 0.03 |
I wish I could also tell you what % of titles are “cutesy”. While searching for a special character in titles is simple, classifying a title as “cutesy” is not. I leave this exercise to the reader.
I also leave the reader with this very relatable content from Racheal Meager for all of us who feel compelled to create cutesy titles:
Nothing annoys me more than papers with cutesy titles and that’s because I am always wrestling with the cutsey-title-writer within
Topics: what do economists write about?
Below I illustrate the most common bigrams (duos of words) in NBER abstracts. The darker the arrow, the more frequent the bigram. The most common are: “monetary policy”, “labor market” and “exchange rate”. Checks out.
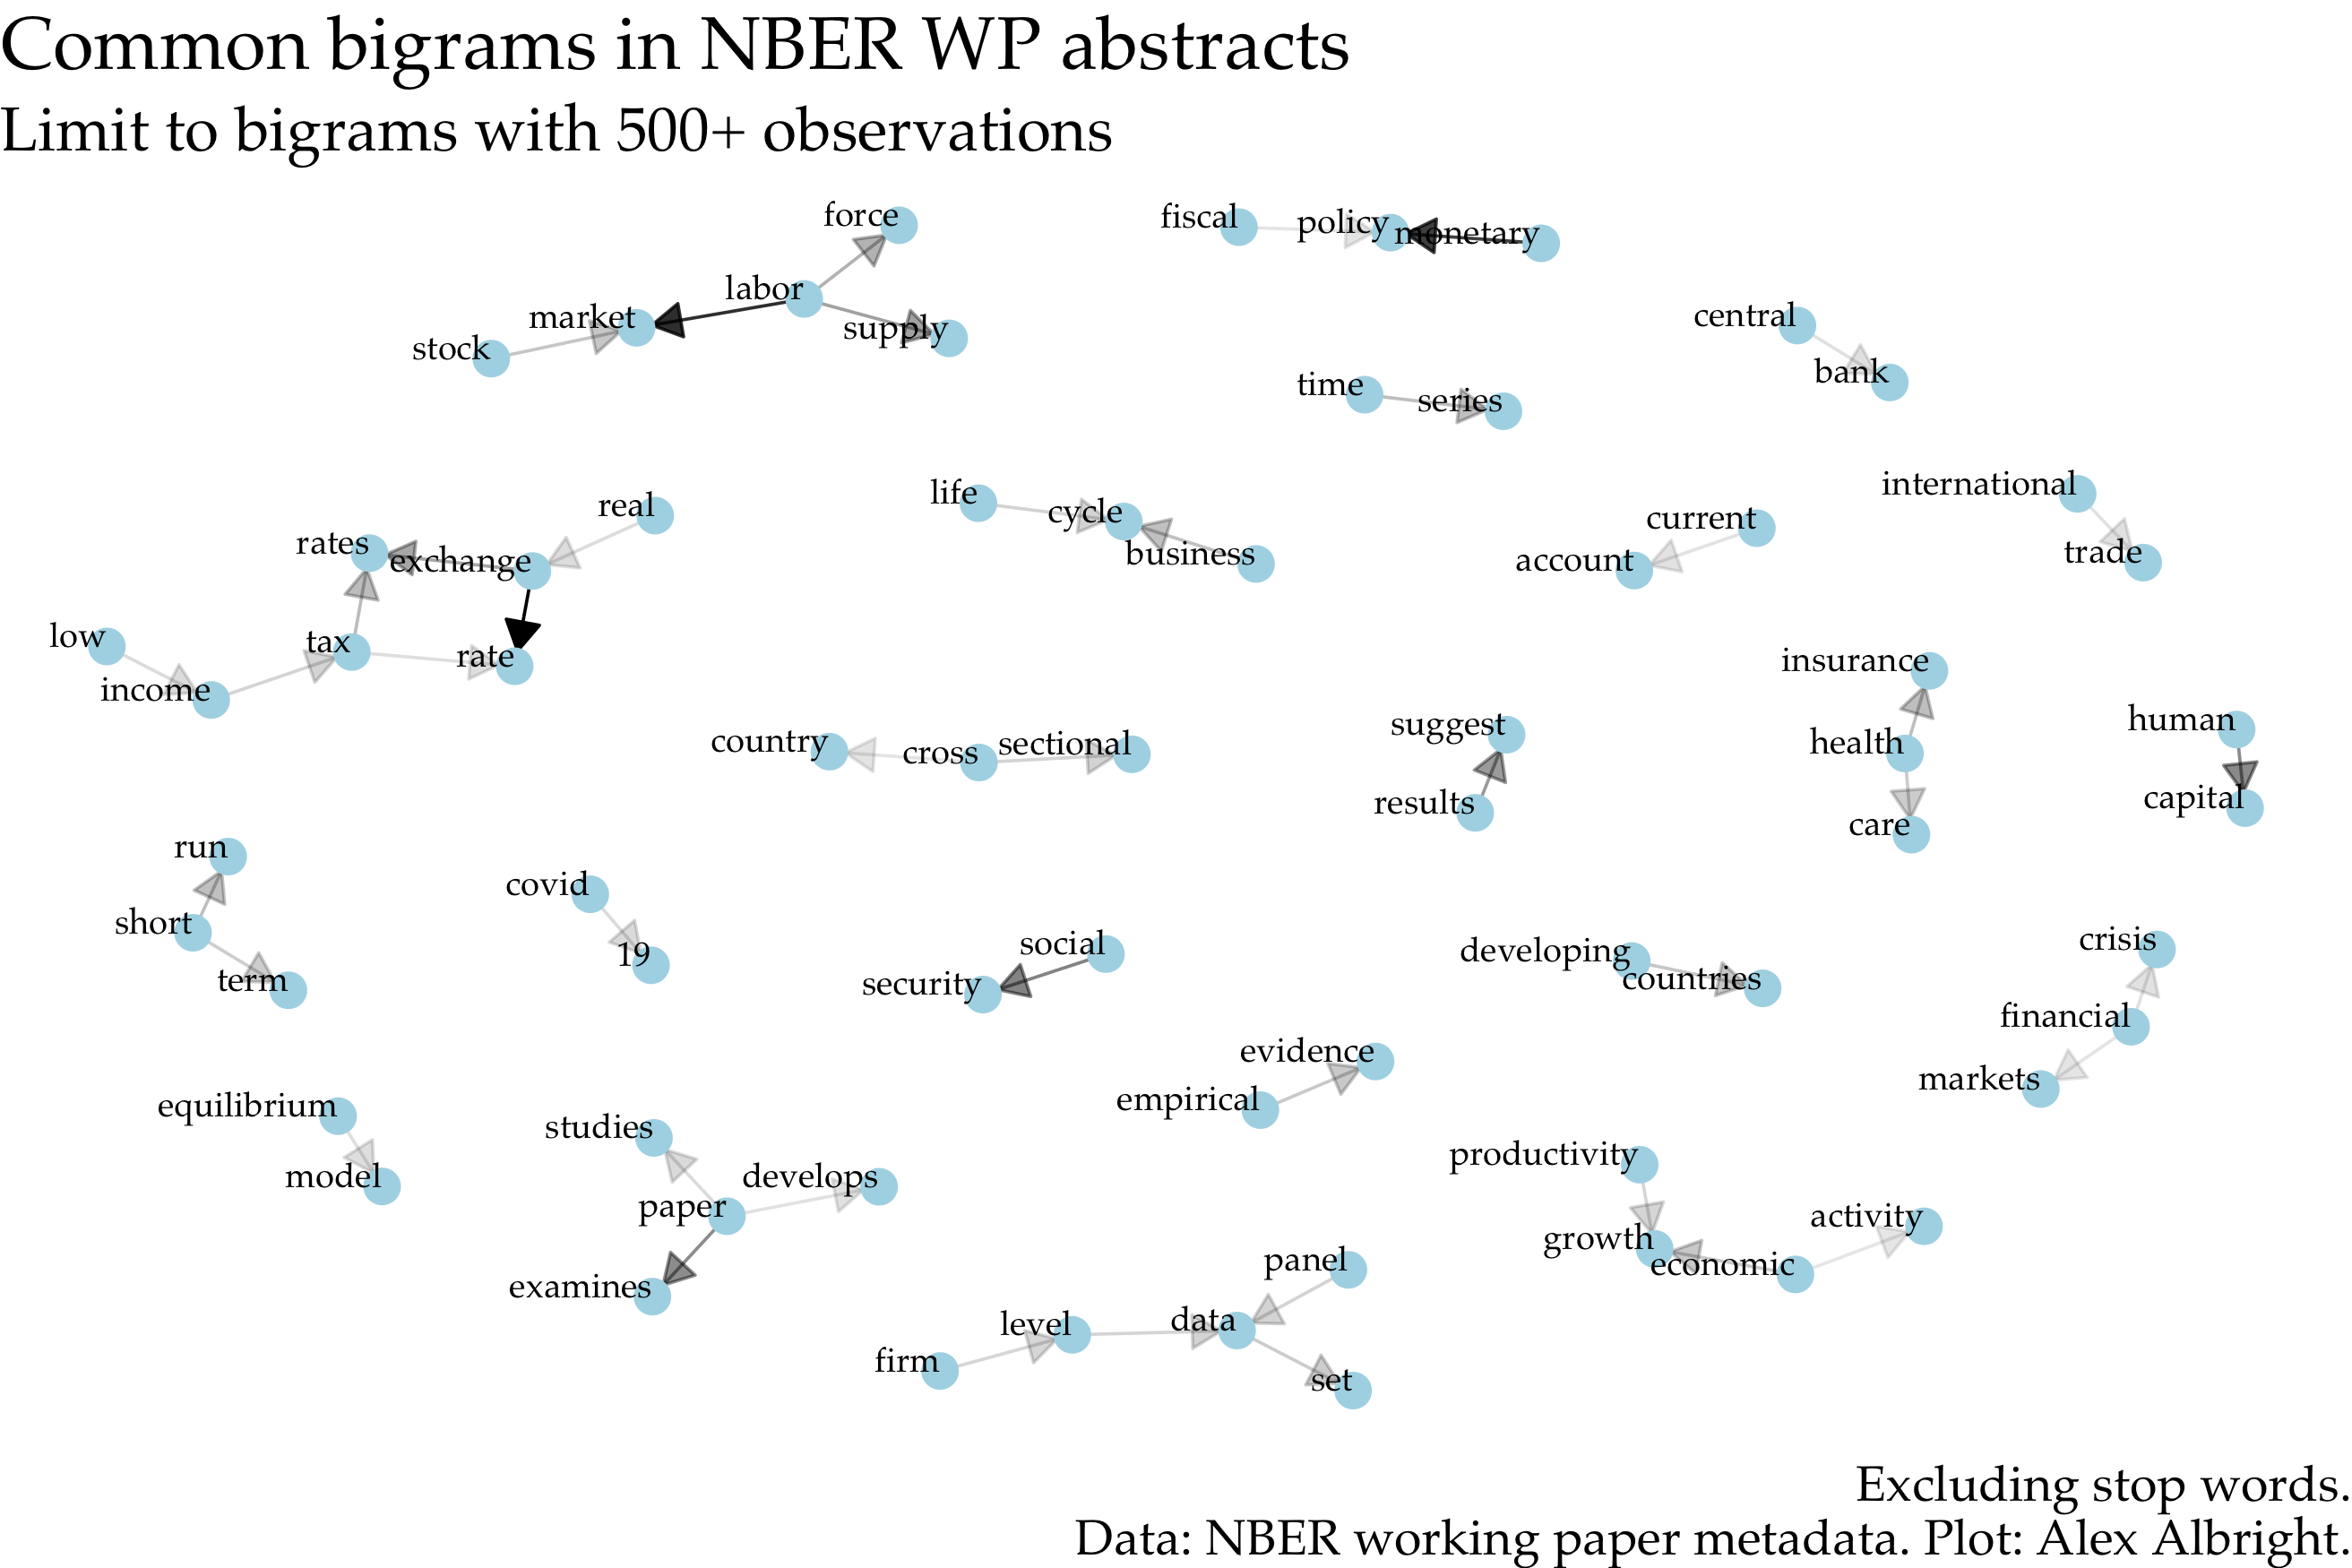
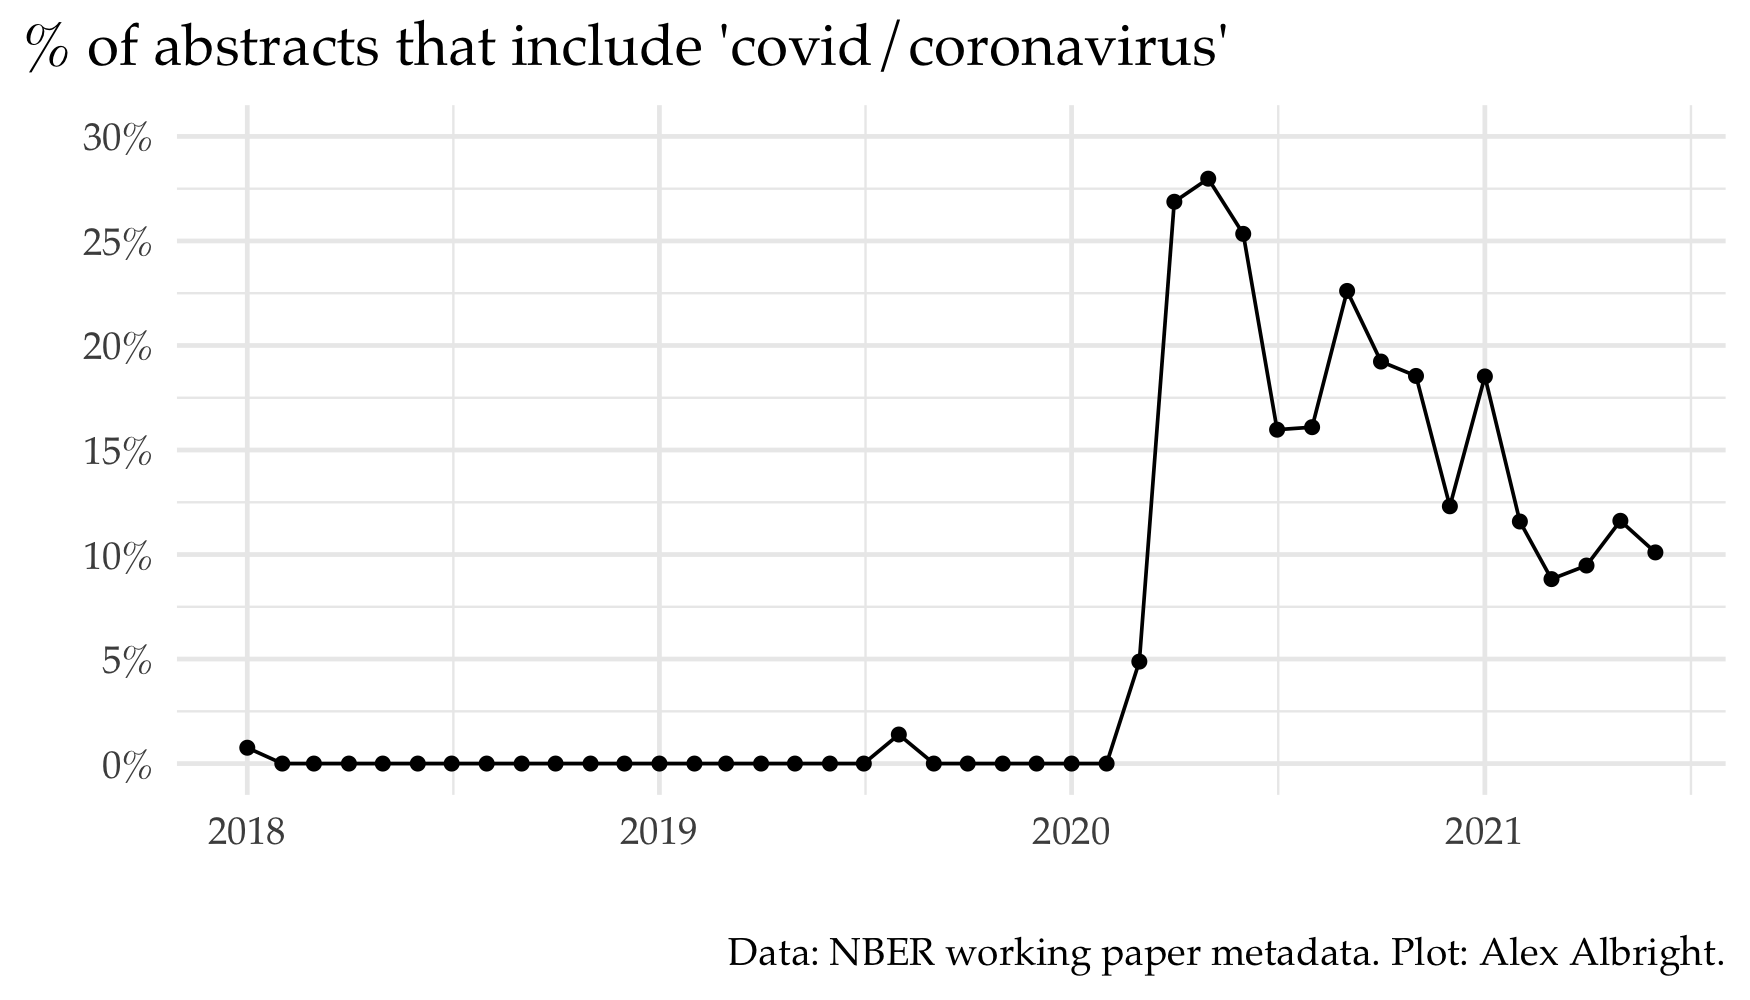
Unsurprisingly, a paper often “suggests”/“develops”/“studies” and “covid” goes with “19”. Covid-19 managed to be among one of the top bigrams for all of 1980-present due to the (understandly) high quantity of papers on the topic in the last ~1.5 years. Related papers were ~27% of April 2020 NBER working papers. Now they are about 10% of new NBER working papers.
Authors: who writes NBER papers?
While the NBER metadata does not have author race or gender in the data, I still think it’s worth taking a shot at showing the demographics of NBER authors. The best I can do is to predict race from last name using US Census data and gender from first name using US Social Security Administration data. I use Jacob Kaplan’s {predictrace} R package to do this. (I am, therefore, limited to the categories specified by the US Census and the US SSA.)
For each year of NBER papers, I calculate the % of authors that are predicted to belong to each racial and/or gender group. In the top panel, I show the picture over time by race and gender separately. In the bottom panel, I show the changes over time across the intersection of race and gender. These plots paint a picture that aligns with well-known facts about the demographics of the economics profession.
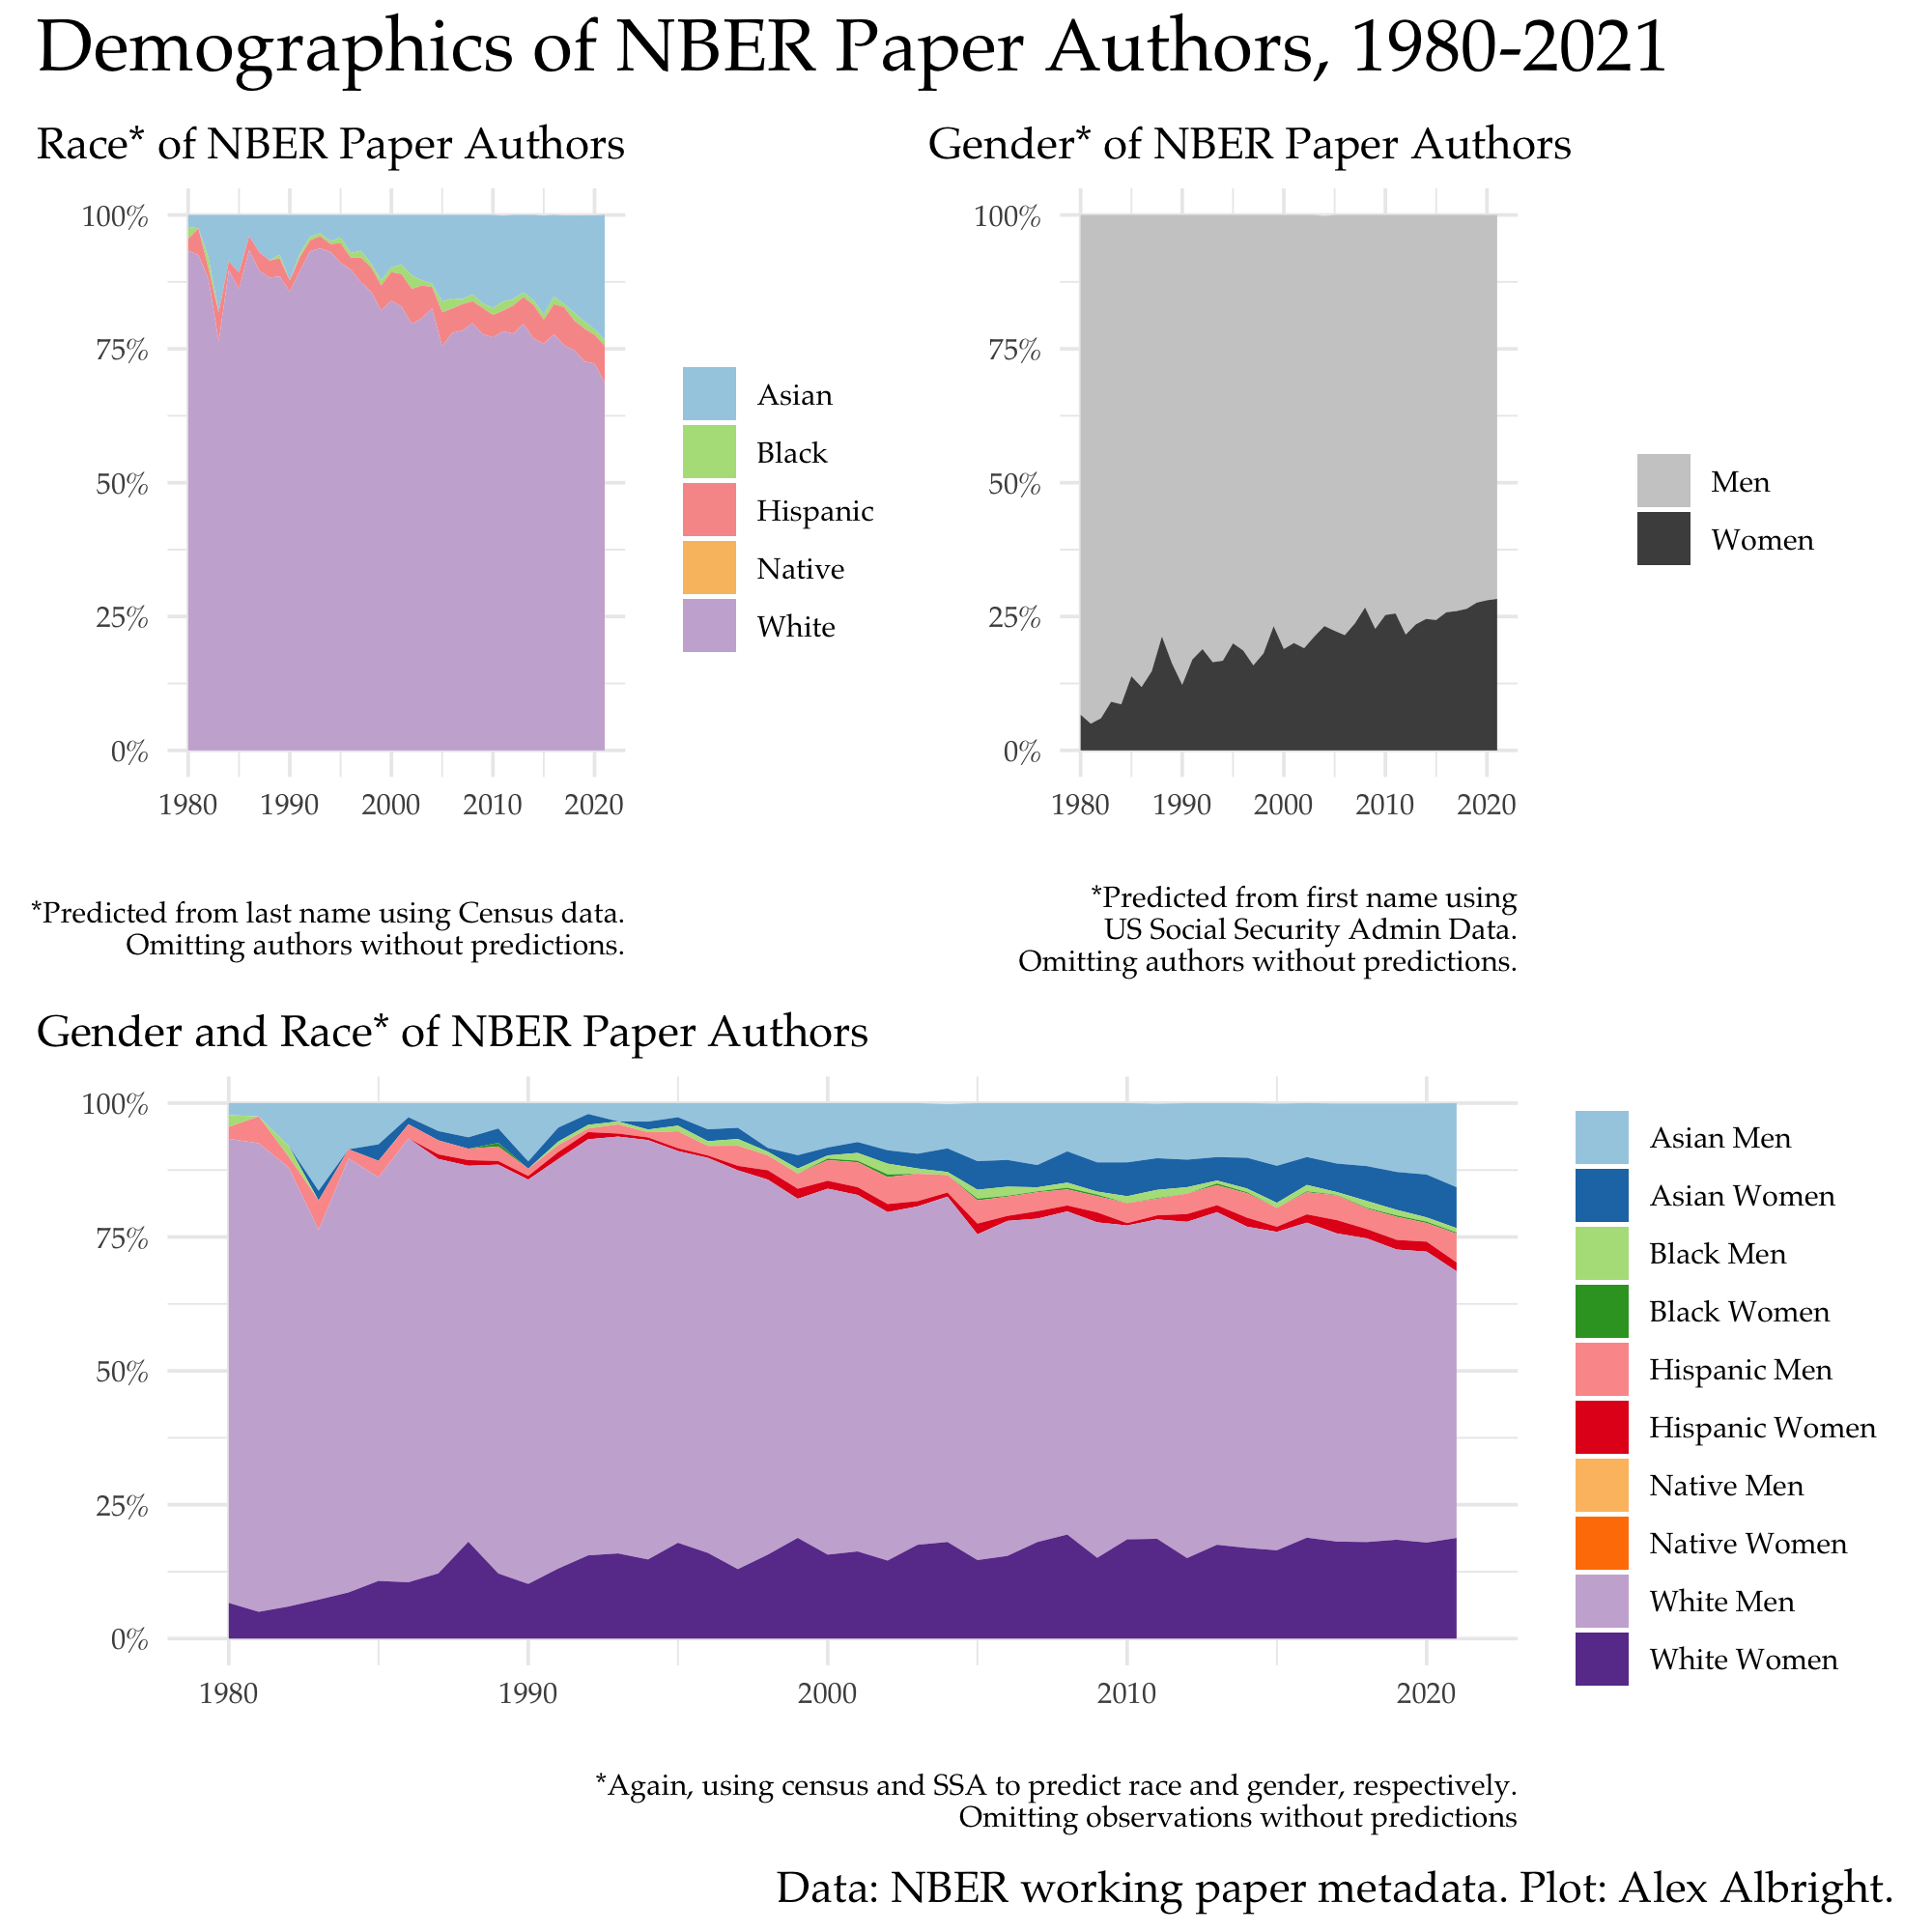
White men are the clear overrepesented majority (ORM). Men are overrepresented relative to women in every racial group. Notice that white women are still a larger share of NBER authors than Asian women, Black men, Black women, Hispanic men, Hispanic women, Native men, and Native women combined. Black women as well as Native men and women are not even visible in the lower panel plot. (See the Sadie Collective website to learn more about the pathway and pipeline problem for Black women in Economics.)
It’s worth breaking down how the descriptive statistics from the plot align with prior research on representation in economics.
According to the name-based predictions, in 2020, ~6% of NBER authors were Black or Hispanic or Native scholars while ~28% of NBER authors were women. These percentages are close to overall faculty percentages from (Doleac, Hengel, and Pancotti, 2021) – “[t]he best data available suggest that 7.3 percent of full-time faculty are URM scholars (Hoover and Washington 2020)” and “[i]n 2019, 21.2 percent of all tenure-track faculty were women, and 24.3 percent of all faculty were women (Levenstein 2020)”.7
The area plot style here is similar to a recent investigation into race and gender of Fed directors. In terms of summary stats, eyeballing their graphs, it looks like ~30/110 (27%) directors are non-white while ~40/110 (36%) are women. The corresponding stats for NBER authors are 30% and 28%, respectively.
Where are economists writing about?
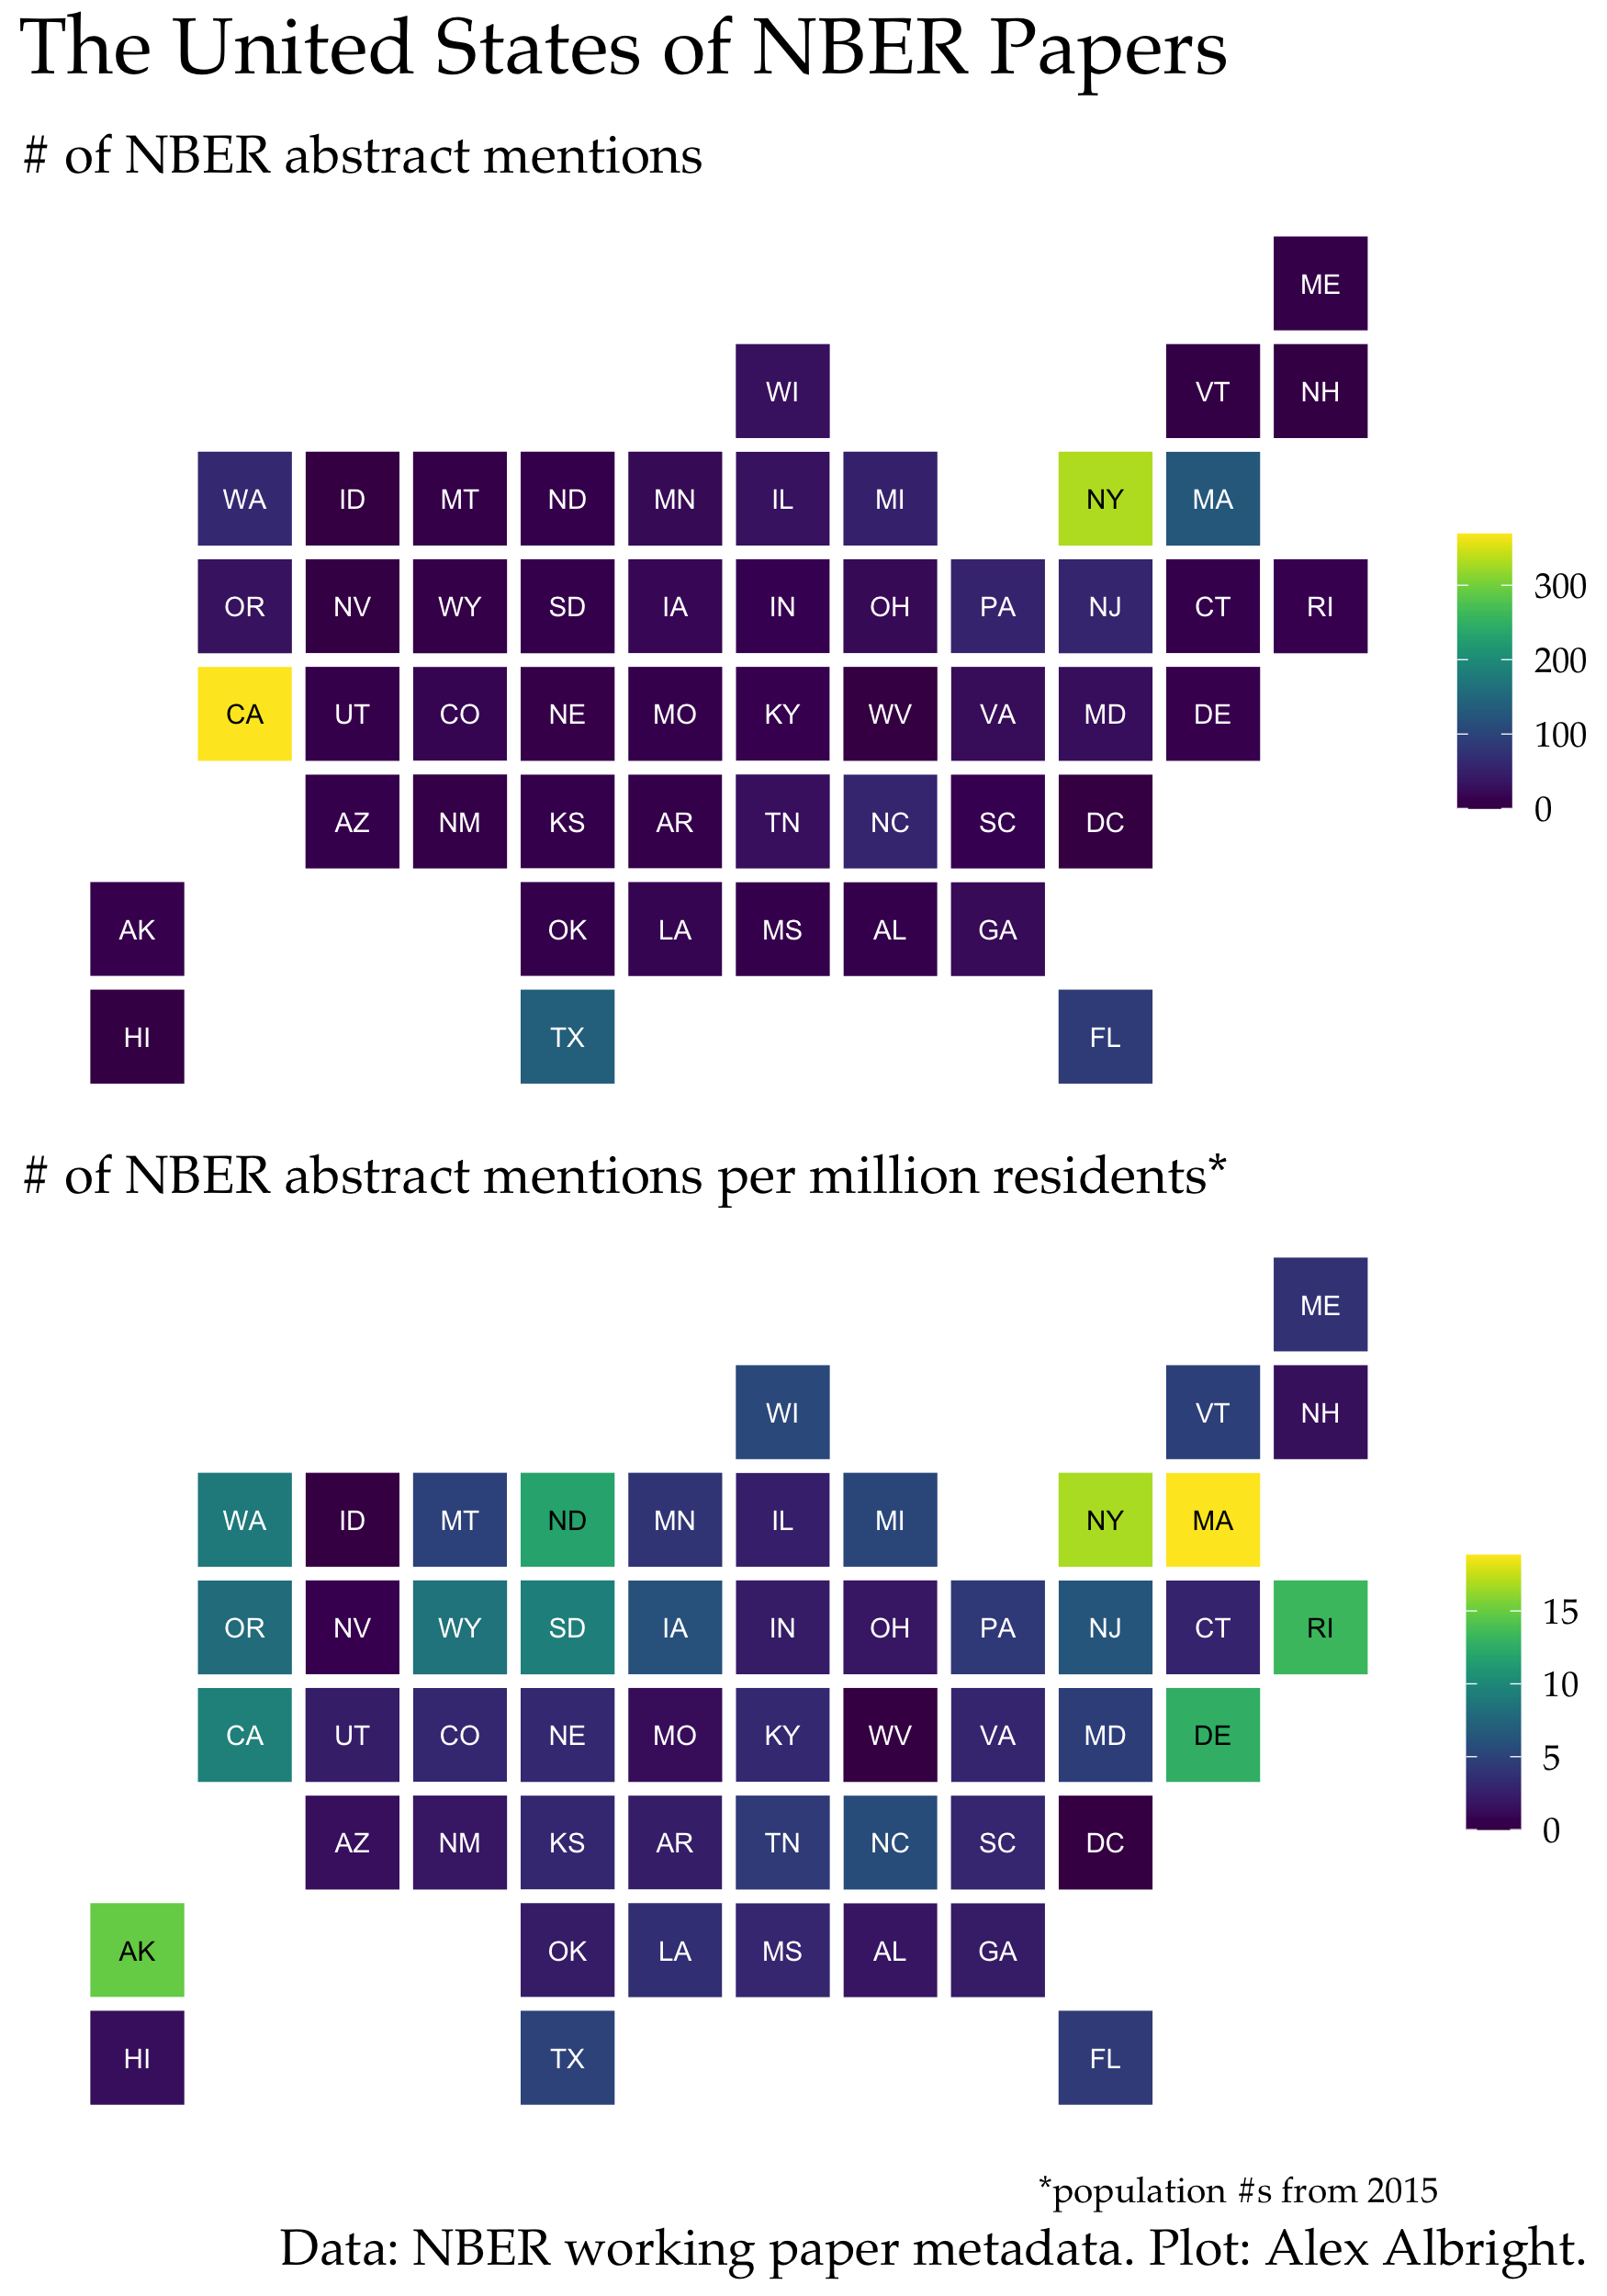
As someone who regularly requests data for projects, I’ve always been very curious whether there is an abundance or scarcity of data in certain parts of the country. My sense is that data requesting is very path dependent – if another researcher got data from place X, then dozens of other researchers may also request that same data since it’s proven to be feasible request. What does # of papers by state or by county look like for specific topics?
Sadly, I can’t observe data usage by place explicitly. (Maybe one day I’ll work on that text analysis…) But, for now, I can see US state mentions in abstracts. (This could mean authors use data from the state or authors are simply discussing the state without data – though the latter would be rare in 2021.)
When I calculate state abstract mentions per million state residents, the very unsurprising result is that there’s a lot of love for Massachusetts, where the NBER is located. Other top states are New York, Alaska, Rhode Island, Delaware, and North Dakota.
Data/Code
Below I provide the data sources as well as code for generating the above plots.
Update (7/7/21): Ben Davies is developing an R package nberwp which contains data on NBER working papers + their authors. Read more about nberwp here. Try it out if you’re interested in using NBER WP data. Also see his related blog posts on “Triadic closure at the NBER” and “Female representation and collaboration at the NBER”.
-
For information on how to extract metadata for a custom bundle of journal articles, check out this recent and developing Twitter thread by Damon Jones. ↩︎
-
See Figure 4 and a few of the appendix tables too. ↩︎
-
The relevant plot uses a Wes Anderson-inspired color palette, which is color vision deficiency friendly. ↩︎
-
With the CKS (2020) data, it looks like over 50% of papers that use quasi-experimental methods use DD methods. ↩︎
-
Check out Text Mining with R for materials on text mining. ↩︎
-
Is this a thing across all social science disciplines? Sure, sure, I guess that’s answerable with more data, but not the subject of this current investigation. ↩︎
-
Relatedly, Kleemans and Thornton (2021) explain that “NBER membership as a share of full-time faculty is similar for men and women”. Another closely related project is Chari and Goldsmith-Pinkham (2018); they document representation of female economists at NBER SI 2001-2018. ↩︎