Intro
About 65% of people in jail in the US have not yet been convicted of a crime. Instead, they are in jail awaiting court action on a charge – they are “pretrial” inmates.1 The most recent BJS numbers estimate that, on a given day, about 482,000 people were pretrial inmates in mid-2017. Over the course of a whole year, millions of people flow in and out of pretrial detention.2 Given ongoing US bail reform efforts, it is extremely policy relevant to better understand descriptive statistics about pretrial populations. As such, I’ll dig into the following string of questions (with a publicly available dataset):
- Why are people admitted to jail pretrial? (I.e., what charges are responsible for the most pretrial detention admissions?)
- What are the demographic characteristics (gender, race, age) of those individuals in jail pretrial? (How does this compare to the general population?)
- What are the bond amounts that pretrial inmates face? (Are the means different by race?)
- How long do people stay in jail pretrial? (Again, are the means different by race?)
- How do bond amounts relate to the length of pretrial detention?
Connecticut Open Data (again)!3
Our ability to answer the above questions is necessarily limited by data availability. I mean, how often do you find high frequency open data on a pretrial population? Well, that’s where open data provided by the Connecticut Department of Corrections comes in. This dataset is, in DOC’s own words,
A listing, updated nightly, of individuals being held in Department of Corrections facilities while awaiting trial. This data is appended on nightly basis reflecting the individual inmates being held in correctional facilities each day beginning July 1, 2016.
The dataset covers all pretrial inmates in DOC facilities from 7/1/16 to present. (I downloaded this on 7/28/19, so I am considering over 3 years of daily data.) The data is deidentified but includes variables such as date, race, gender, age, bond amount, and latest admission date.4
During this time period (7/1/16-7/28/19), 34,892 distinct people were recorded as spending time in a DOC facility pretrial. Note that since the data is recorded nightly, this count is an underestimate of the true number who have flowed through such facilities.5 Some people were detained multiple times – there were 50,247 unique jail admissions of these 34,892 people. Moreover, since someone can be in jail pretrial for multiple charges at once, the data covers 54,367 charges.6
Armed with over three years of pretrial inmate data from Connecticut, I address (with graphs and stats) the aforementioned questions on charges, demographics, bond, and length of stay.
1. What are you in for?
While there were 54,367 charges for which people were detained pretrial in this time period, thousands of people were often facing the same charge. As such, there are only 348 unique charges in the data (spread over 34,892 people and 50,247 pretrial jail admissions). Below is a graph of the top 10 most common charges.7
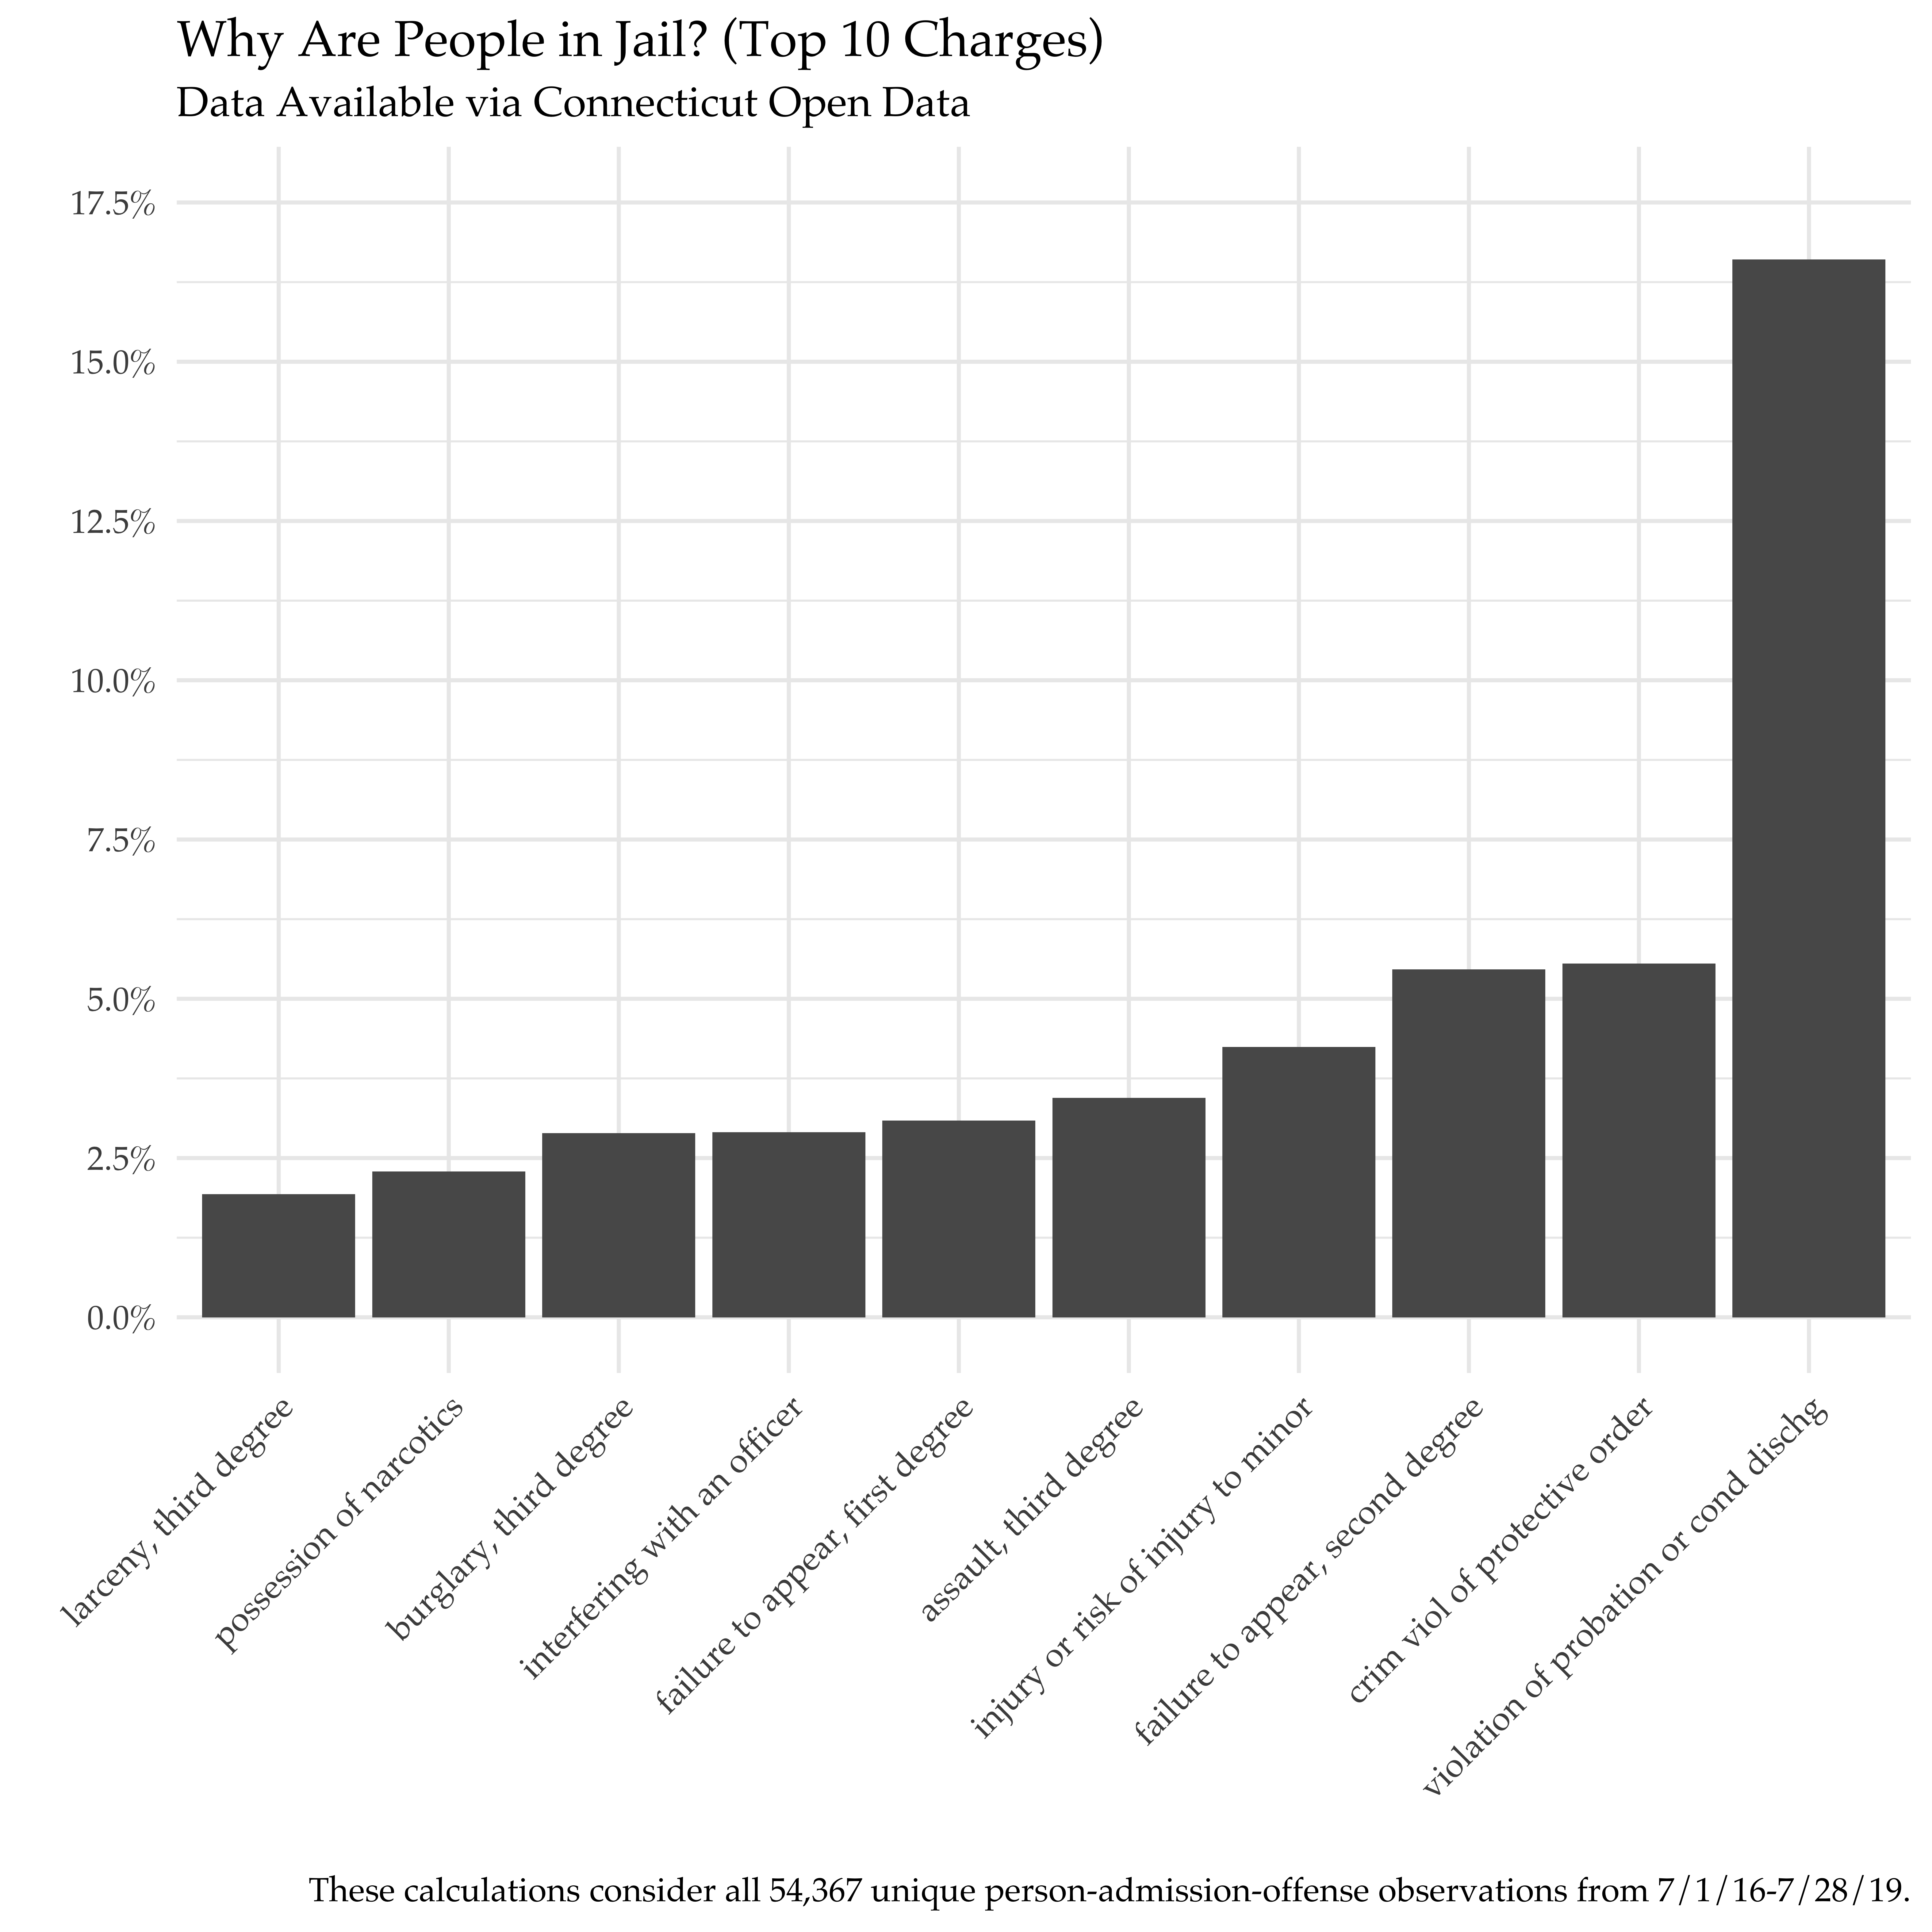
Violation of probation or conditional discharge is far and away the most common reason to end up in jail pretrial.8 The second most common reason is criminal violation of a protective order, but it pales in a comparison of magnitudes. Failure to appear (in court)9 appears twice on this top 10 list (once for first degree and once for second degree). If we combined both degrees of failure to appear, it would be the second most common charge.
People who work in pretrial services agencies will tell you that violations of probation are a big driver of jail admissions; the above graph puts those conversations into stark quantitative terms. This graph also makes the case that working to decrease failure to appear by implementing tools like court text reminders would address another large driver of pretrial jail admissions.
2. Who is in jail pretrial?
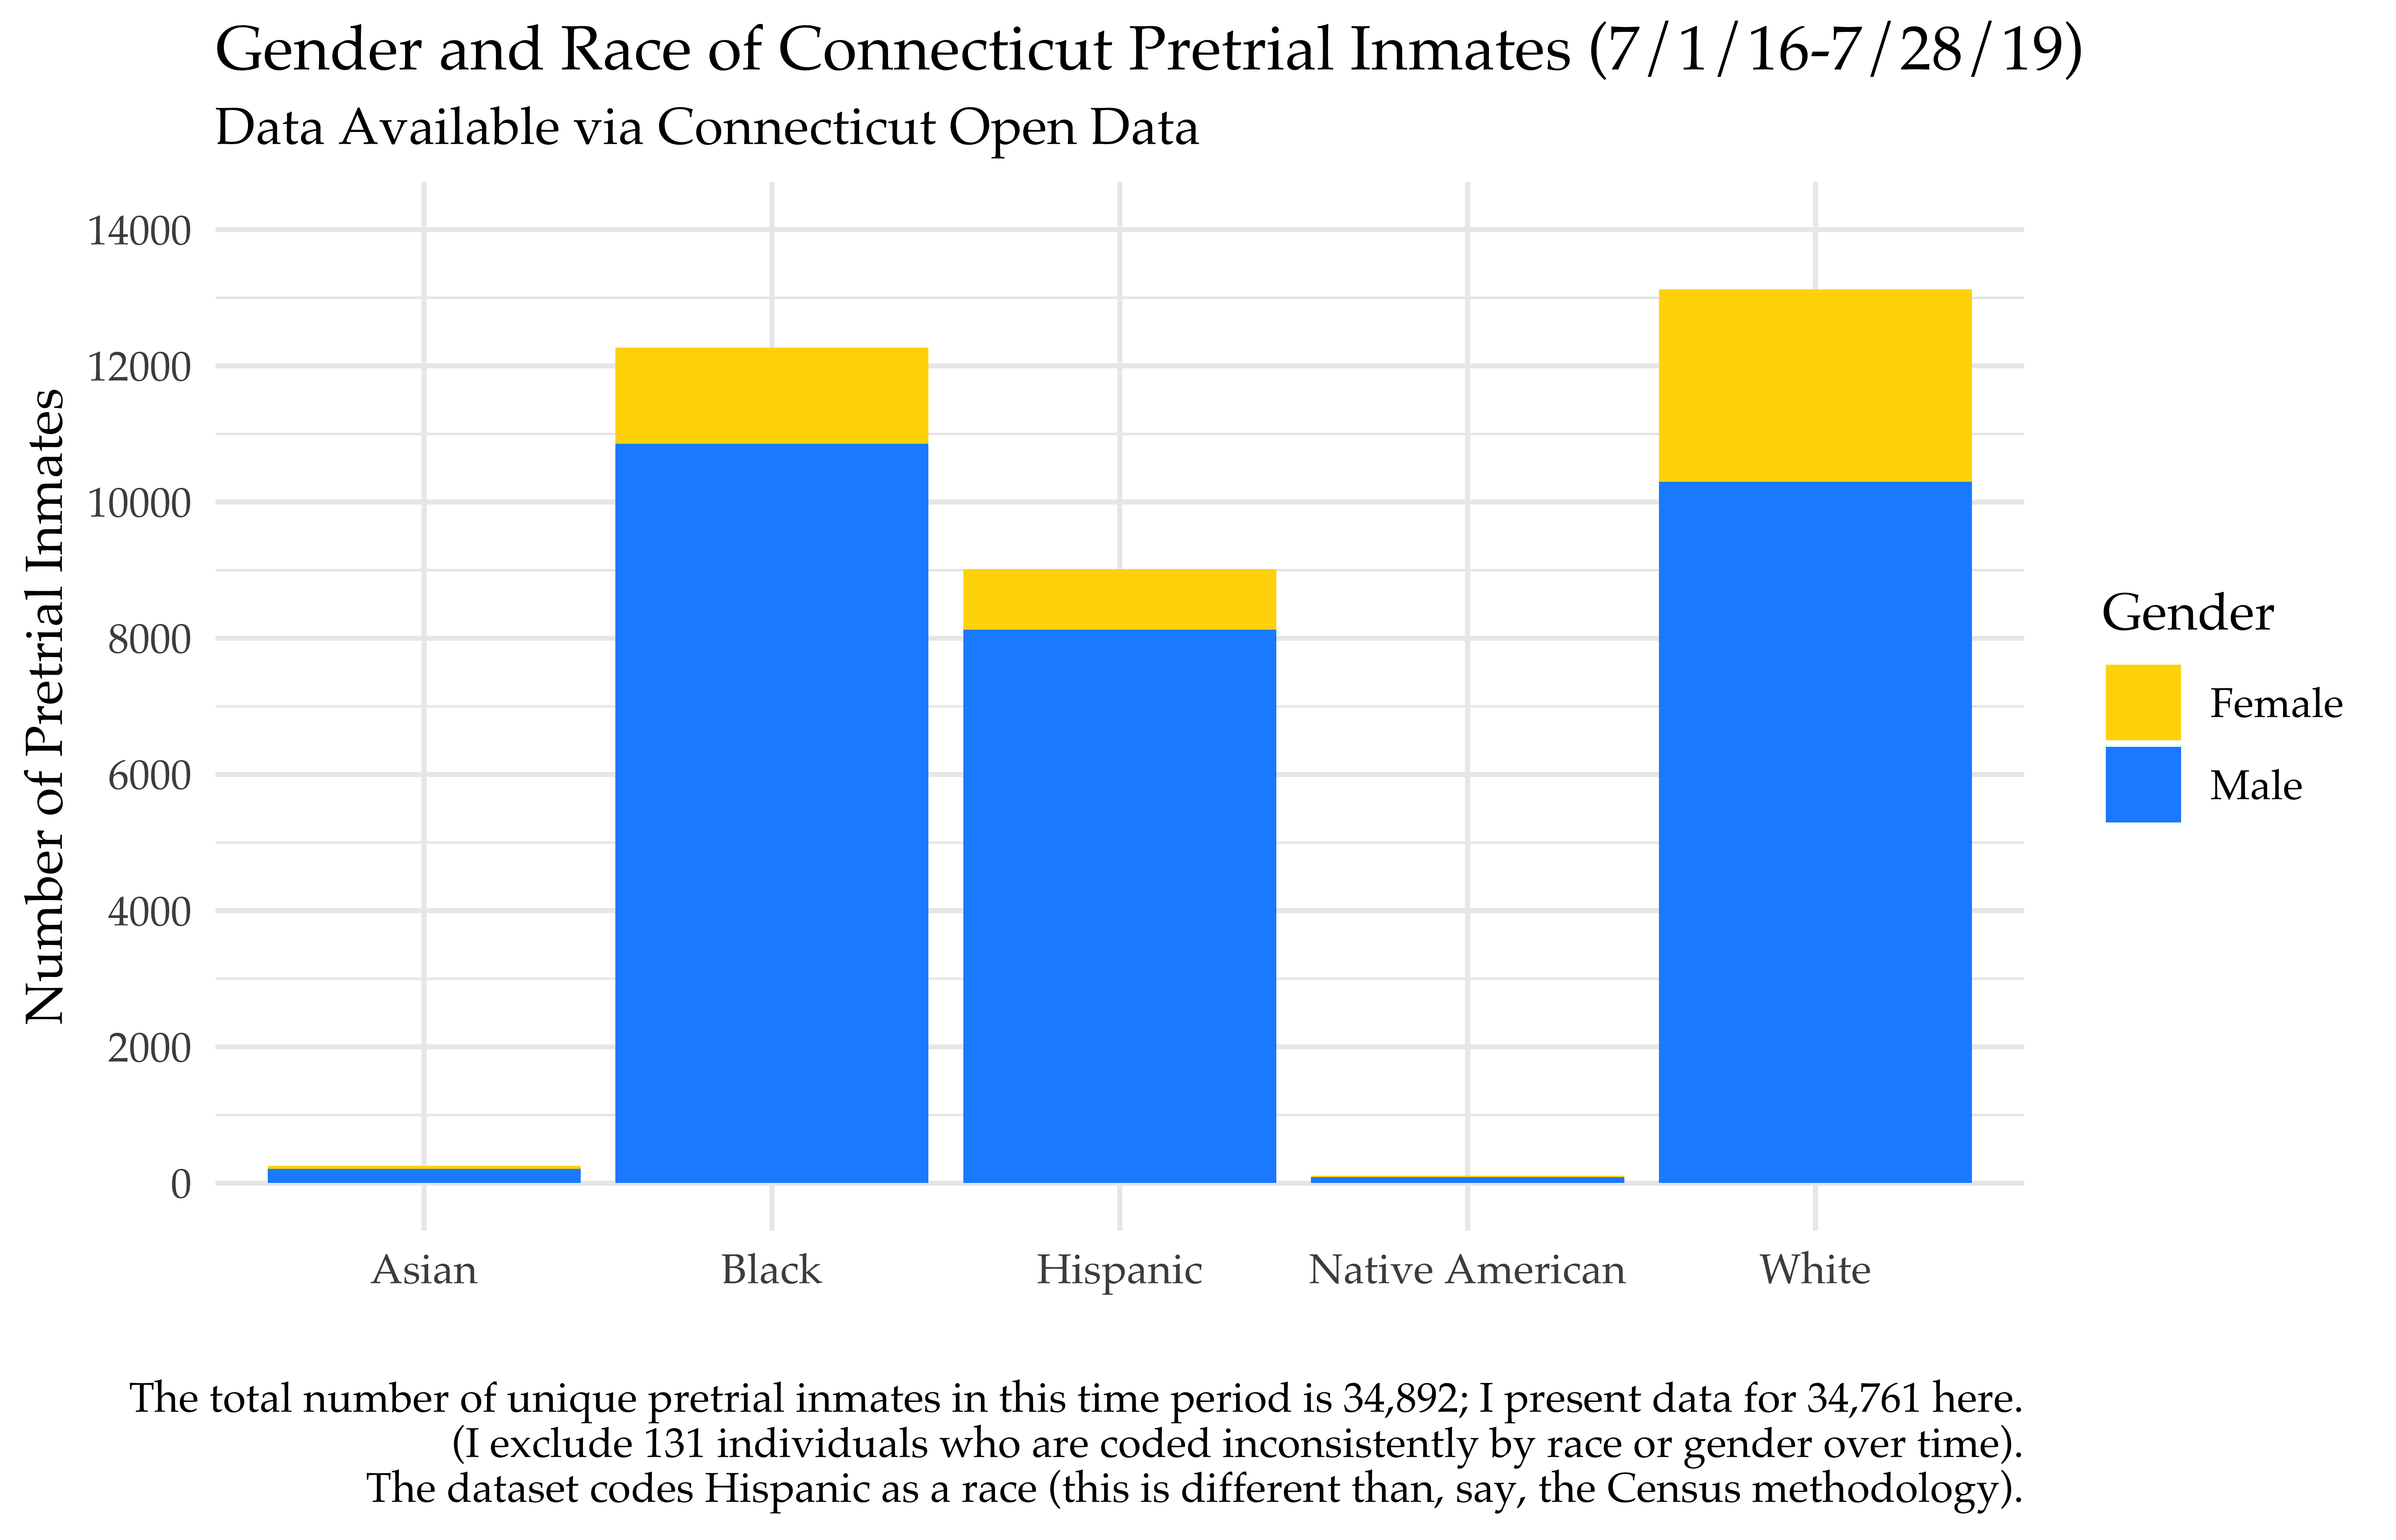
Not surprisingly, men are significantly over-represented in this pretrial inmate population compared to women. In terms of race, people who self-identified as black or Hispanic are over-represented compared to those who self-identify as white or Asian.
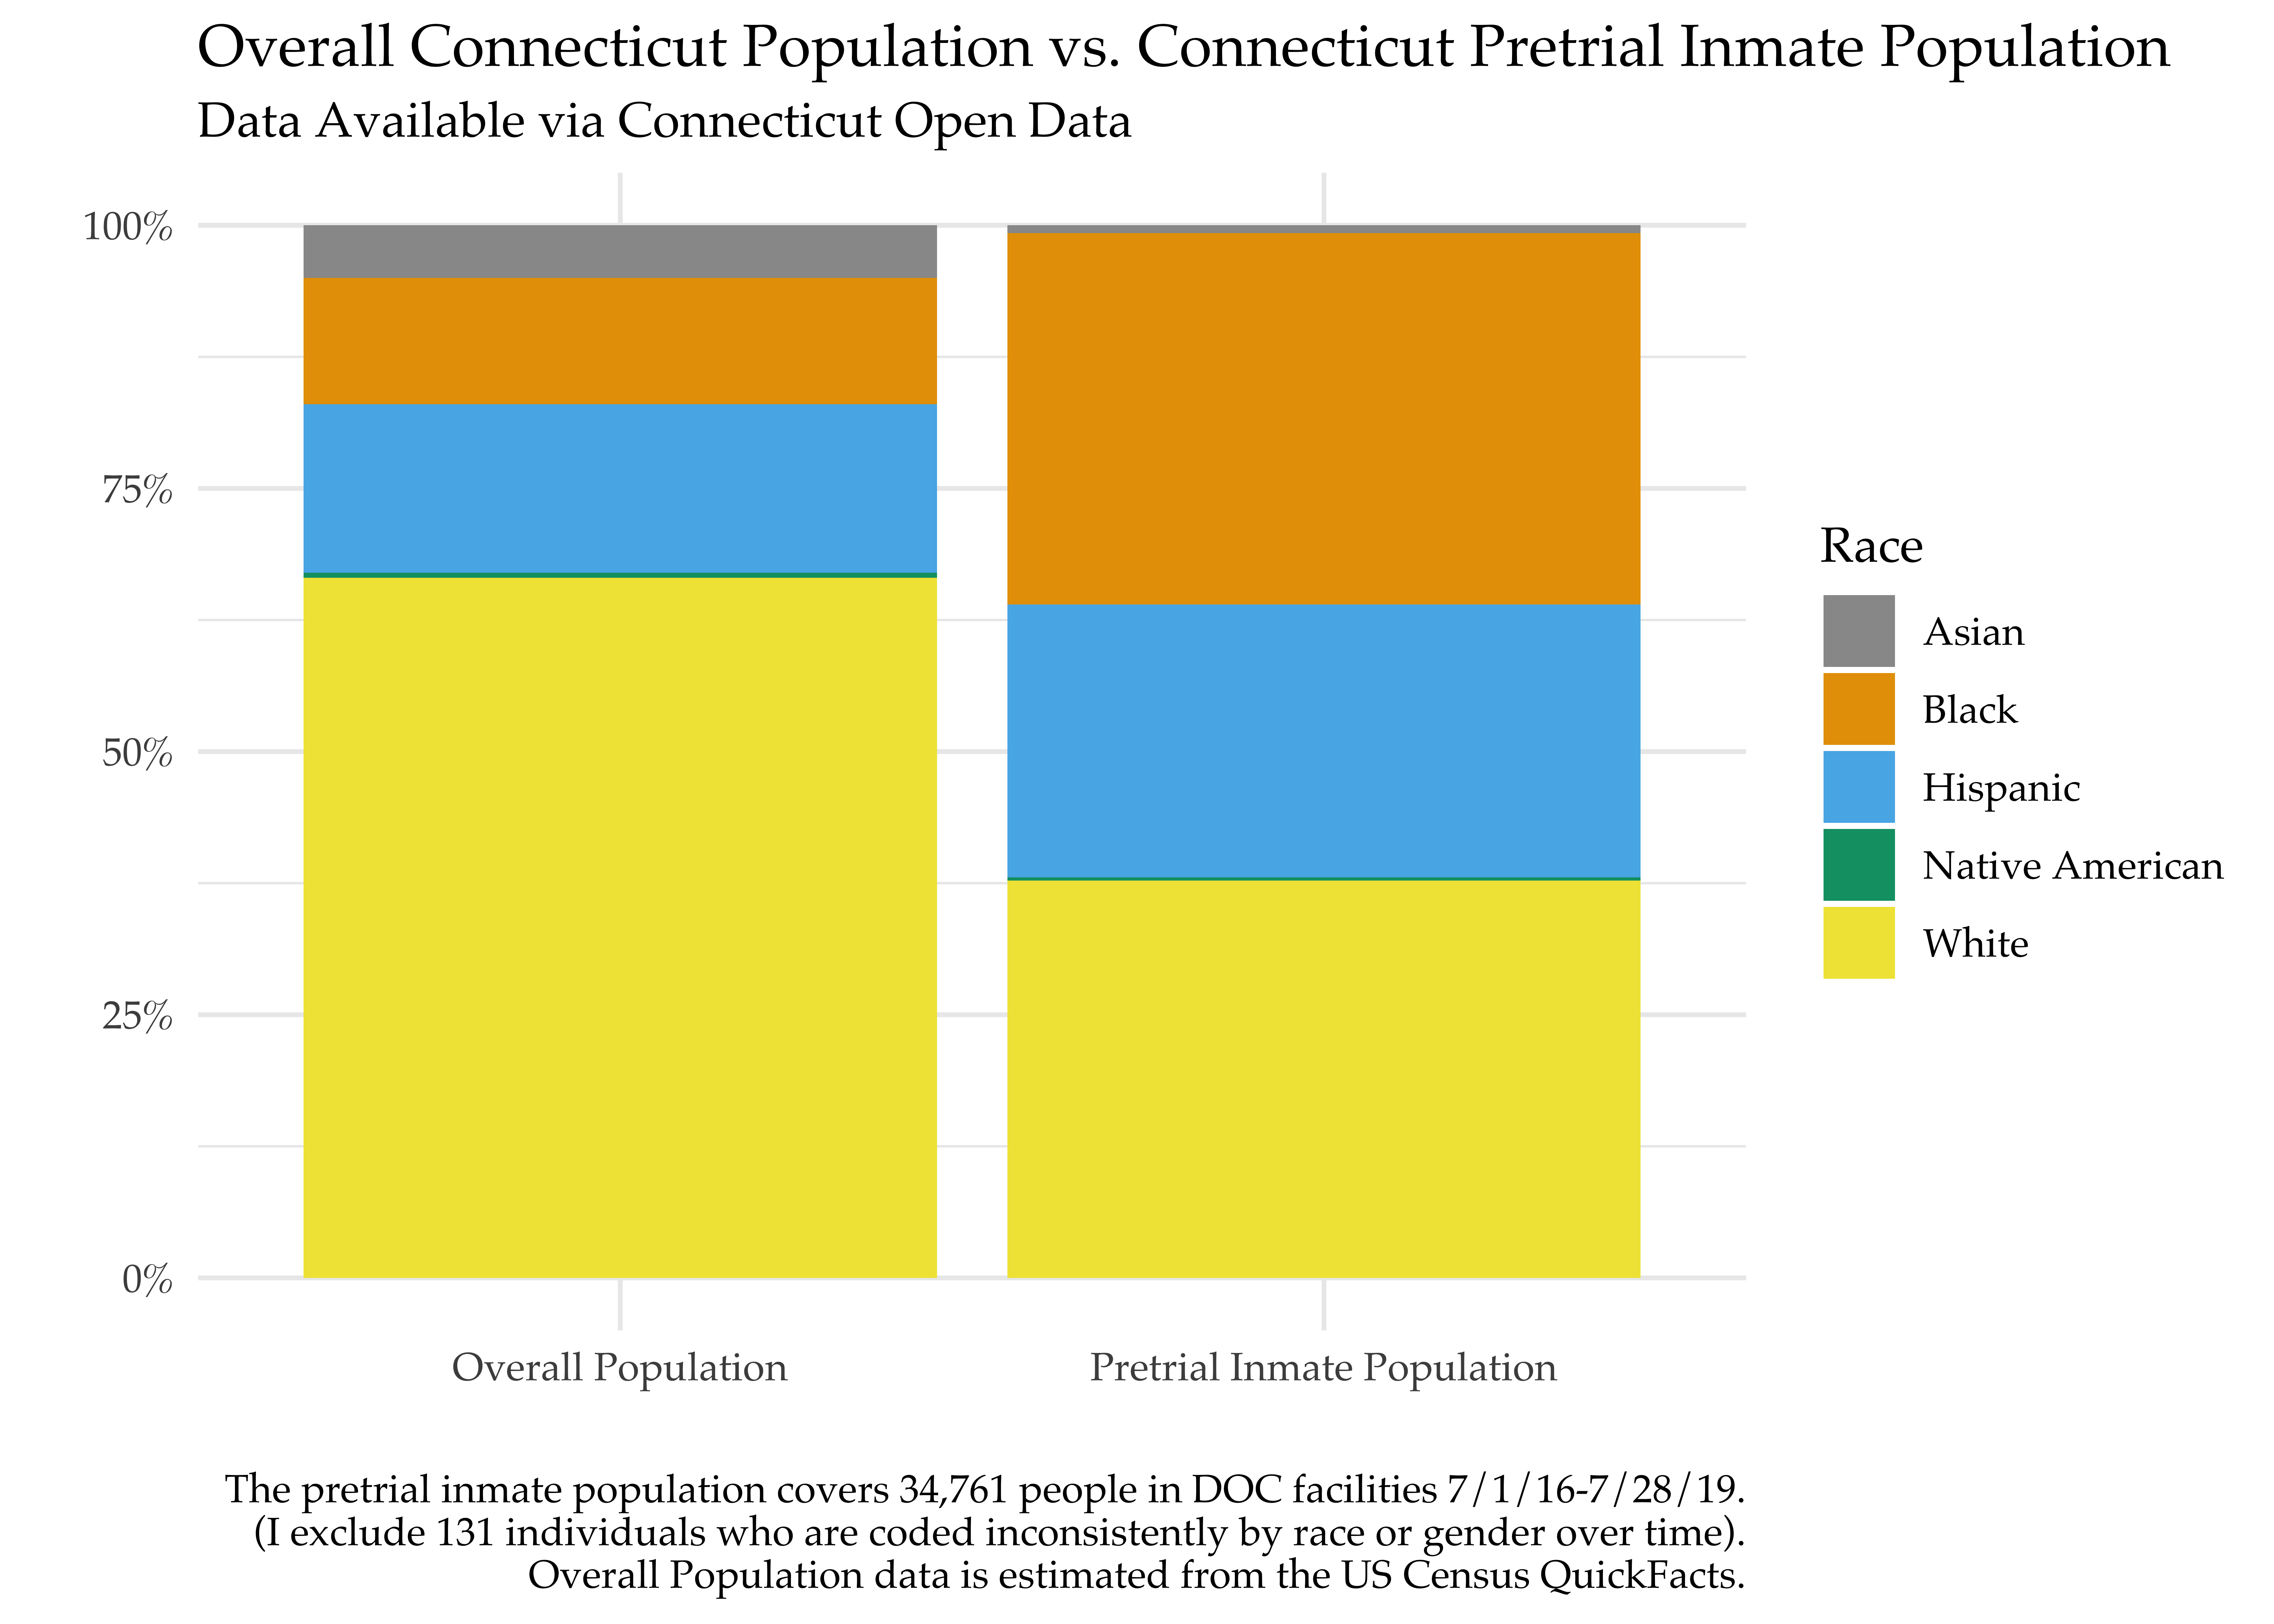
In order to more clearly demonstrate the difference between racial composition in the Connecticut pretrial inmate population and the general Connecticut population, I use estimates from the Census.10 The below makes the over-representation of black and Hispanic defendants more visually explicit.
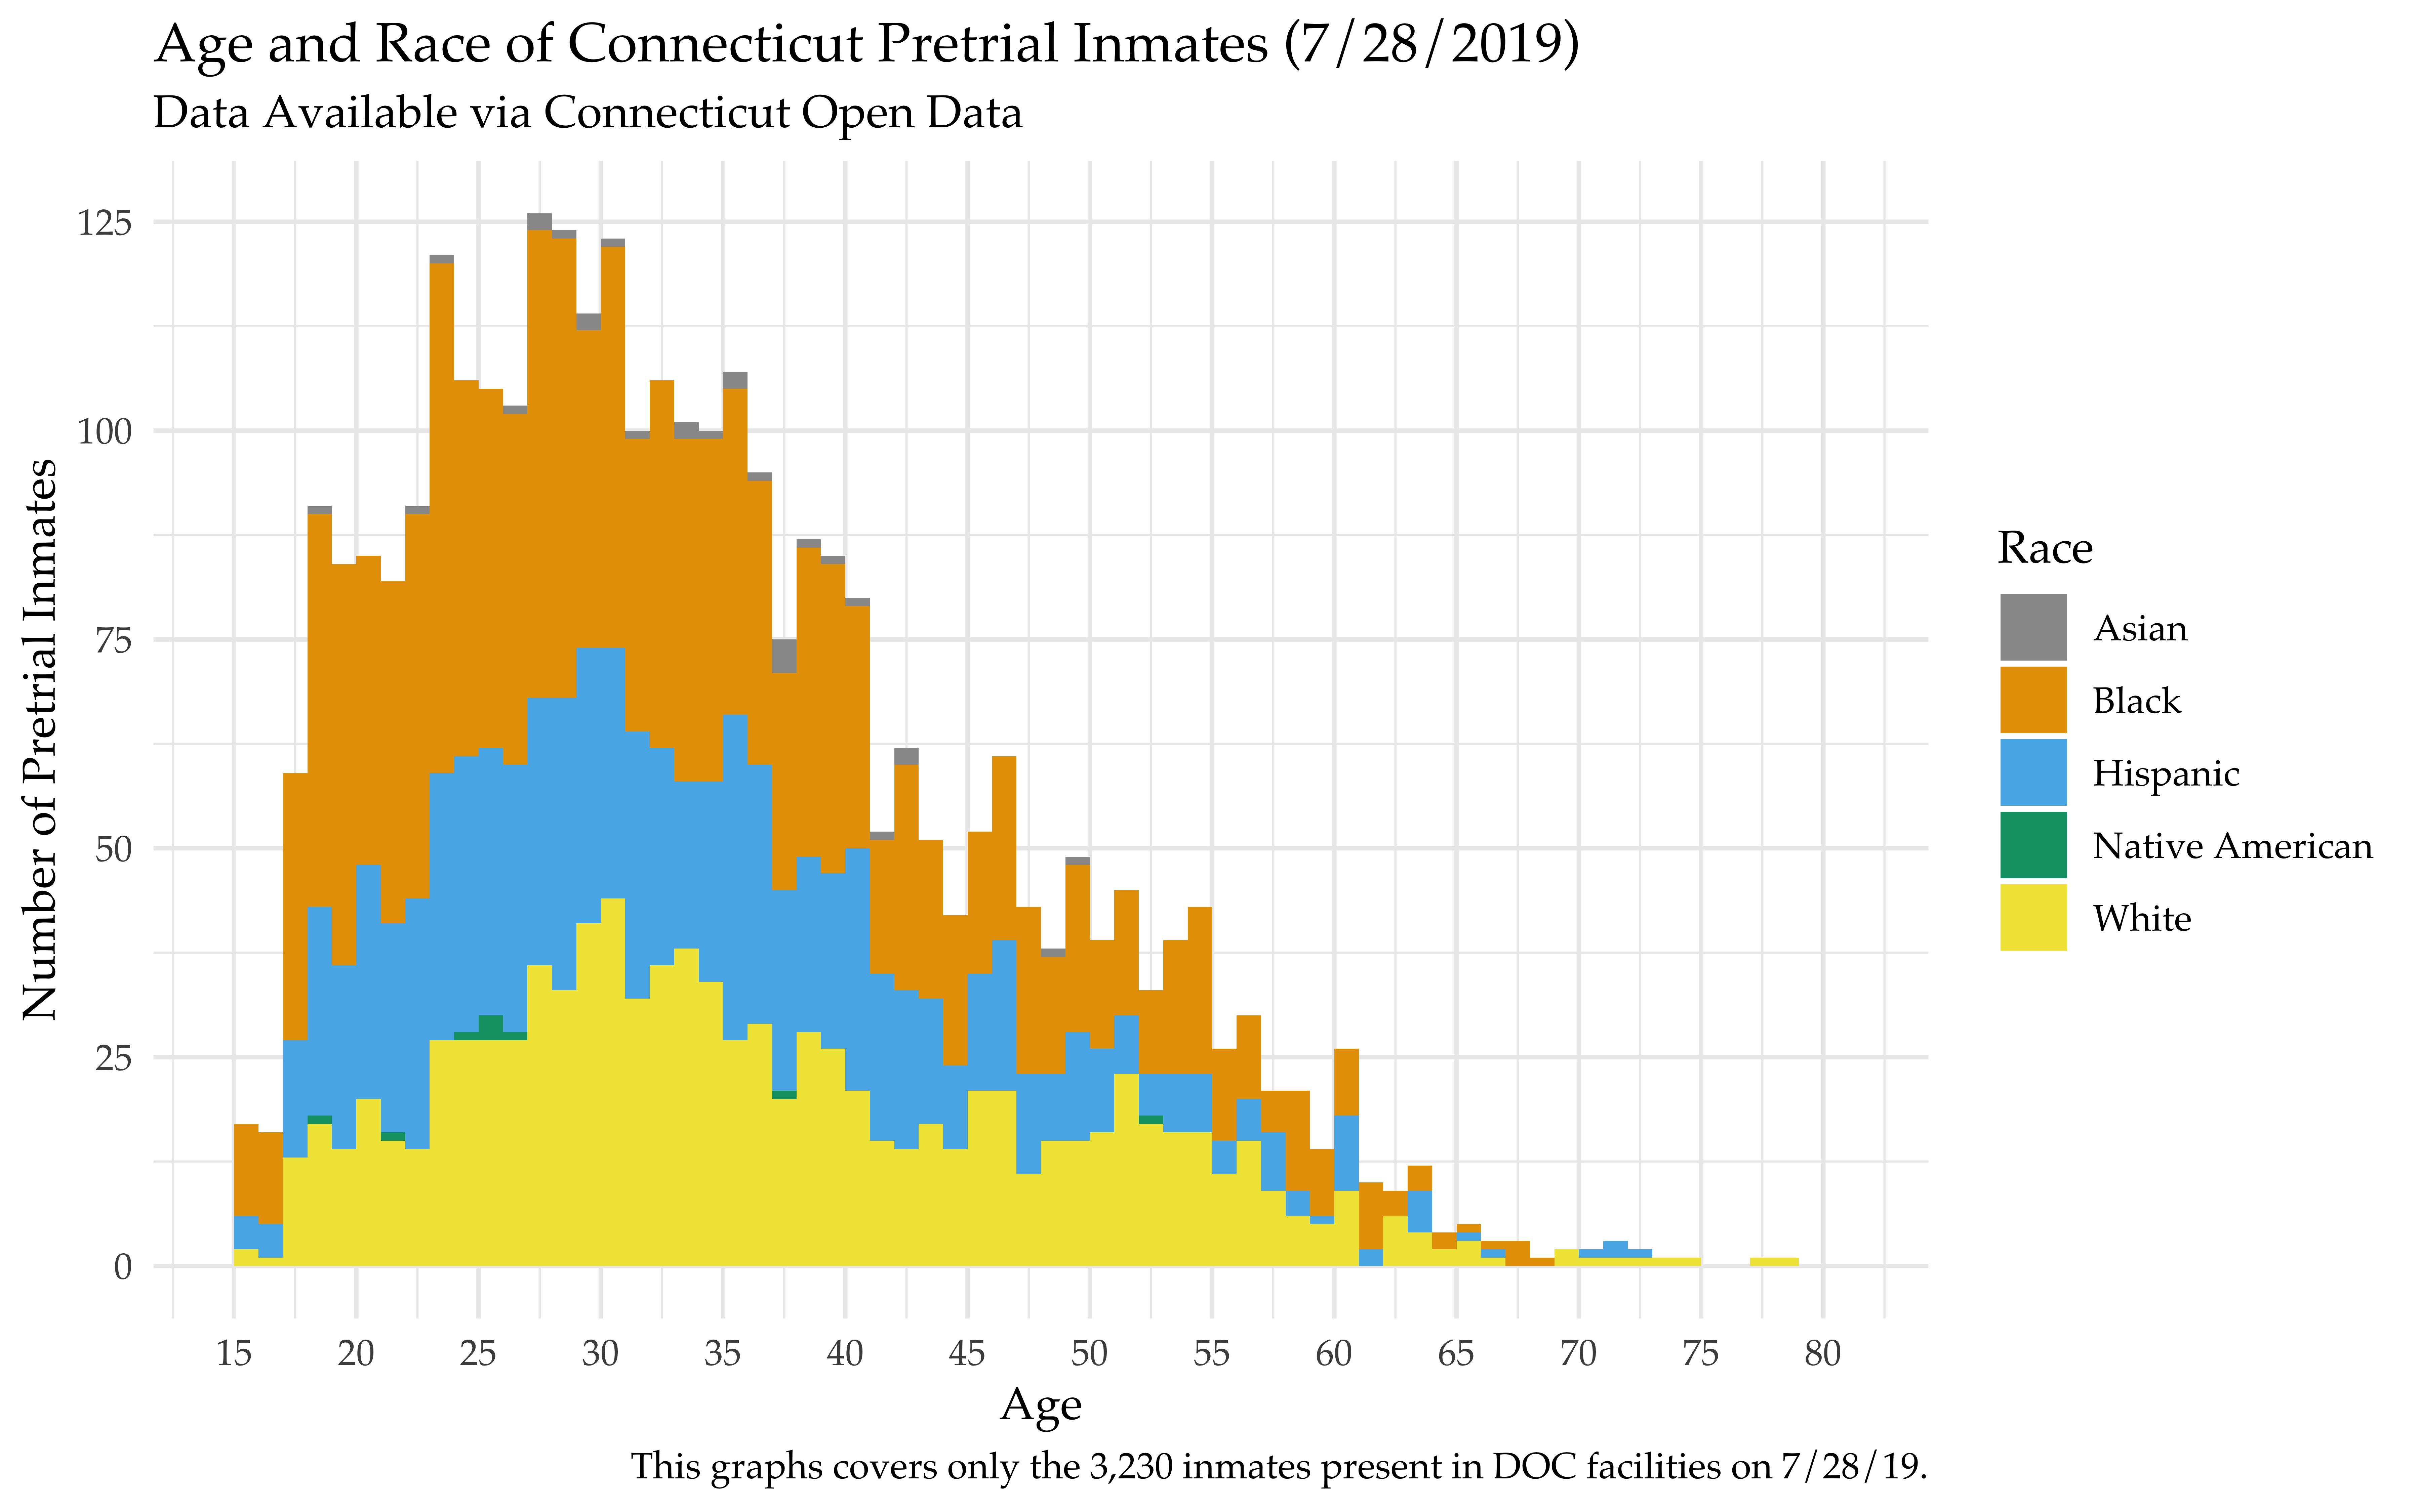
To get a snapshot of the age distribution, I focus on the most recent day in the dataset11 – 7/28/19. As expected, the pretrial inmate population is skewed young, with a median age of 33 compared to a median age of ~41 in the general Connecticut population.
3. Bail me out?
Bond amounts set financial conditions for pretrial release. Bond can be changed during an inmate’s jail stay, so, for the sake of clarity, I focus here on the original (first) bond amount in the data.12 Excluding those individuals who are coded inconsistently by race or gender yields 49,817 first observations of bond for all unique person-admissions.
The mean bond amount is $85,881 and the median is $25,100. This all seems shockingly high to me, but it is worth noting that this distribution is likely higher than the general bond distribution since this data covers only those who are in jail for at least one night. That is, selection into this sample likely leads to an overestimate of the true bond amount distribution.
Given the enormous range, I want to visualize the distribution of bond amounts for pretrial inmates. However, without a transformation, it’s extremely difficult (impossible) to see because there are huge values on the right (in the millions) while most of the mass is on the left. To deal with this, I use a log10 transformation of the axis with bond amount.
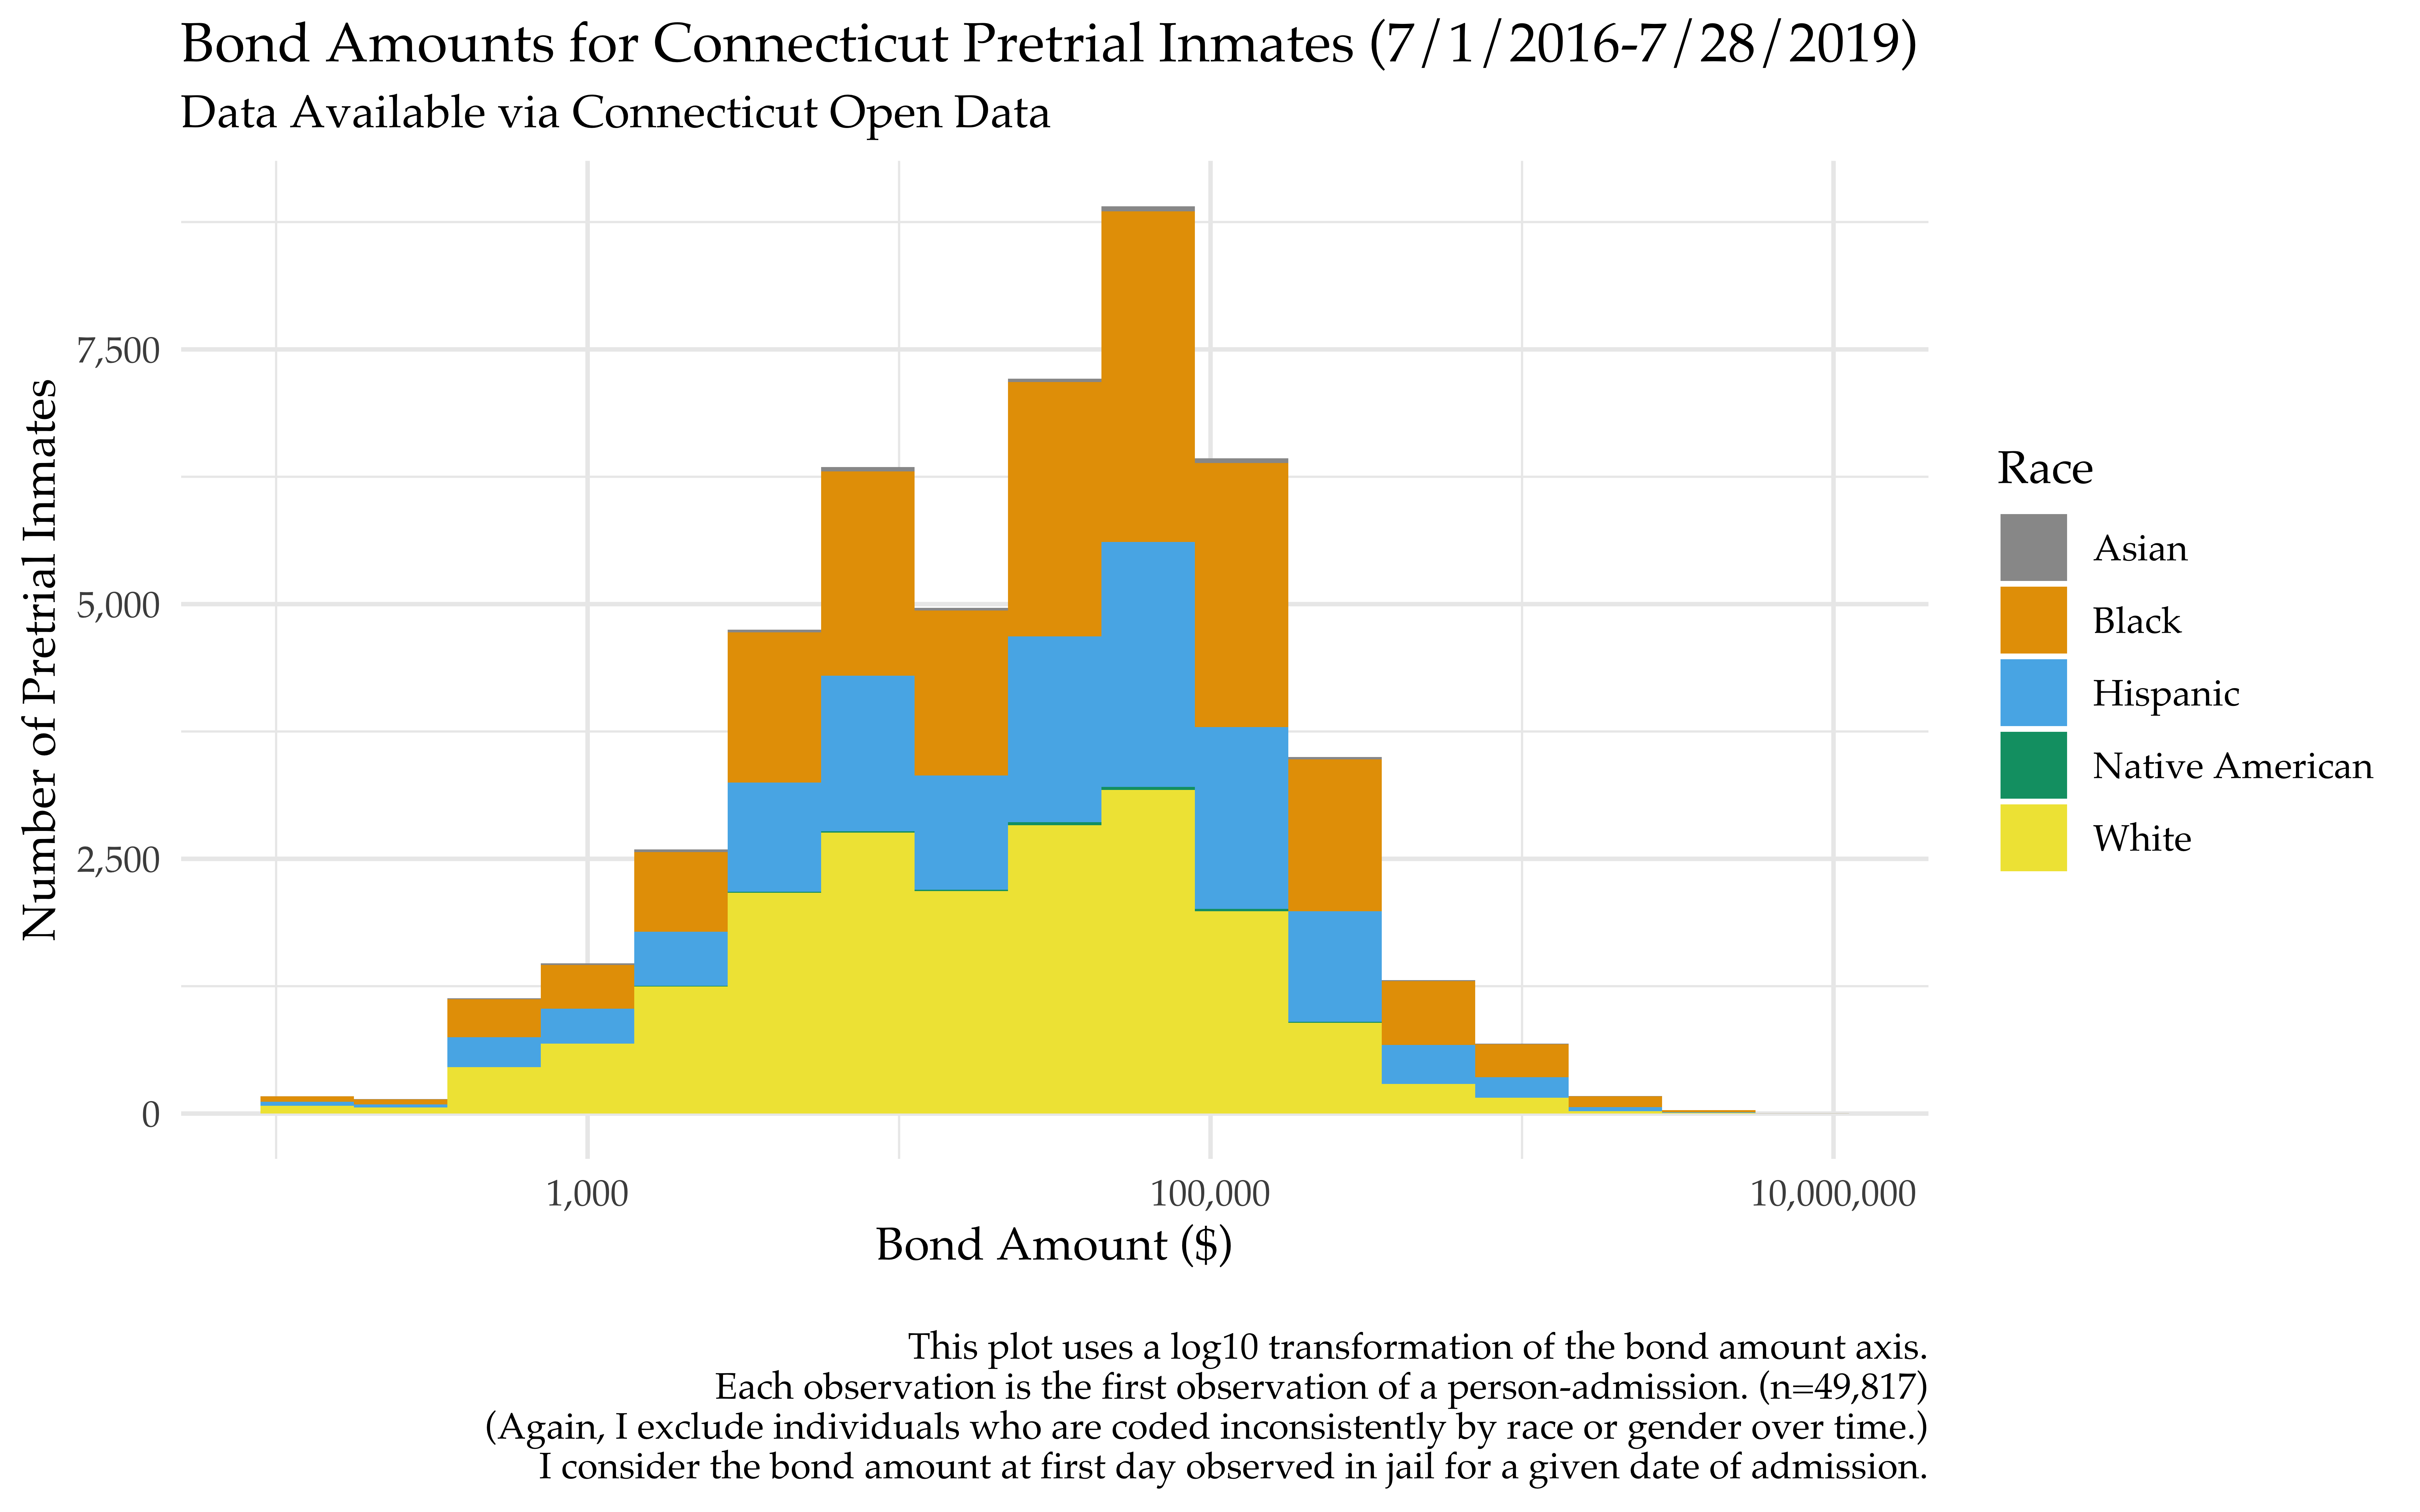
The coloring of the above distribution doesn’t make it clear whether pretrial inmate bond amounts are different by racial group.13 To address this, I plot the mean bond amount by group with 95% confidence intervals.
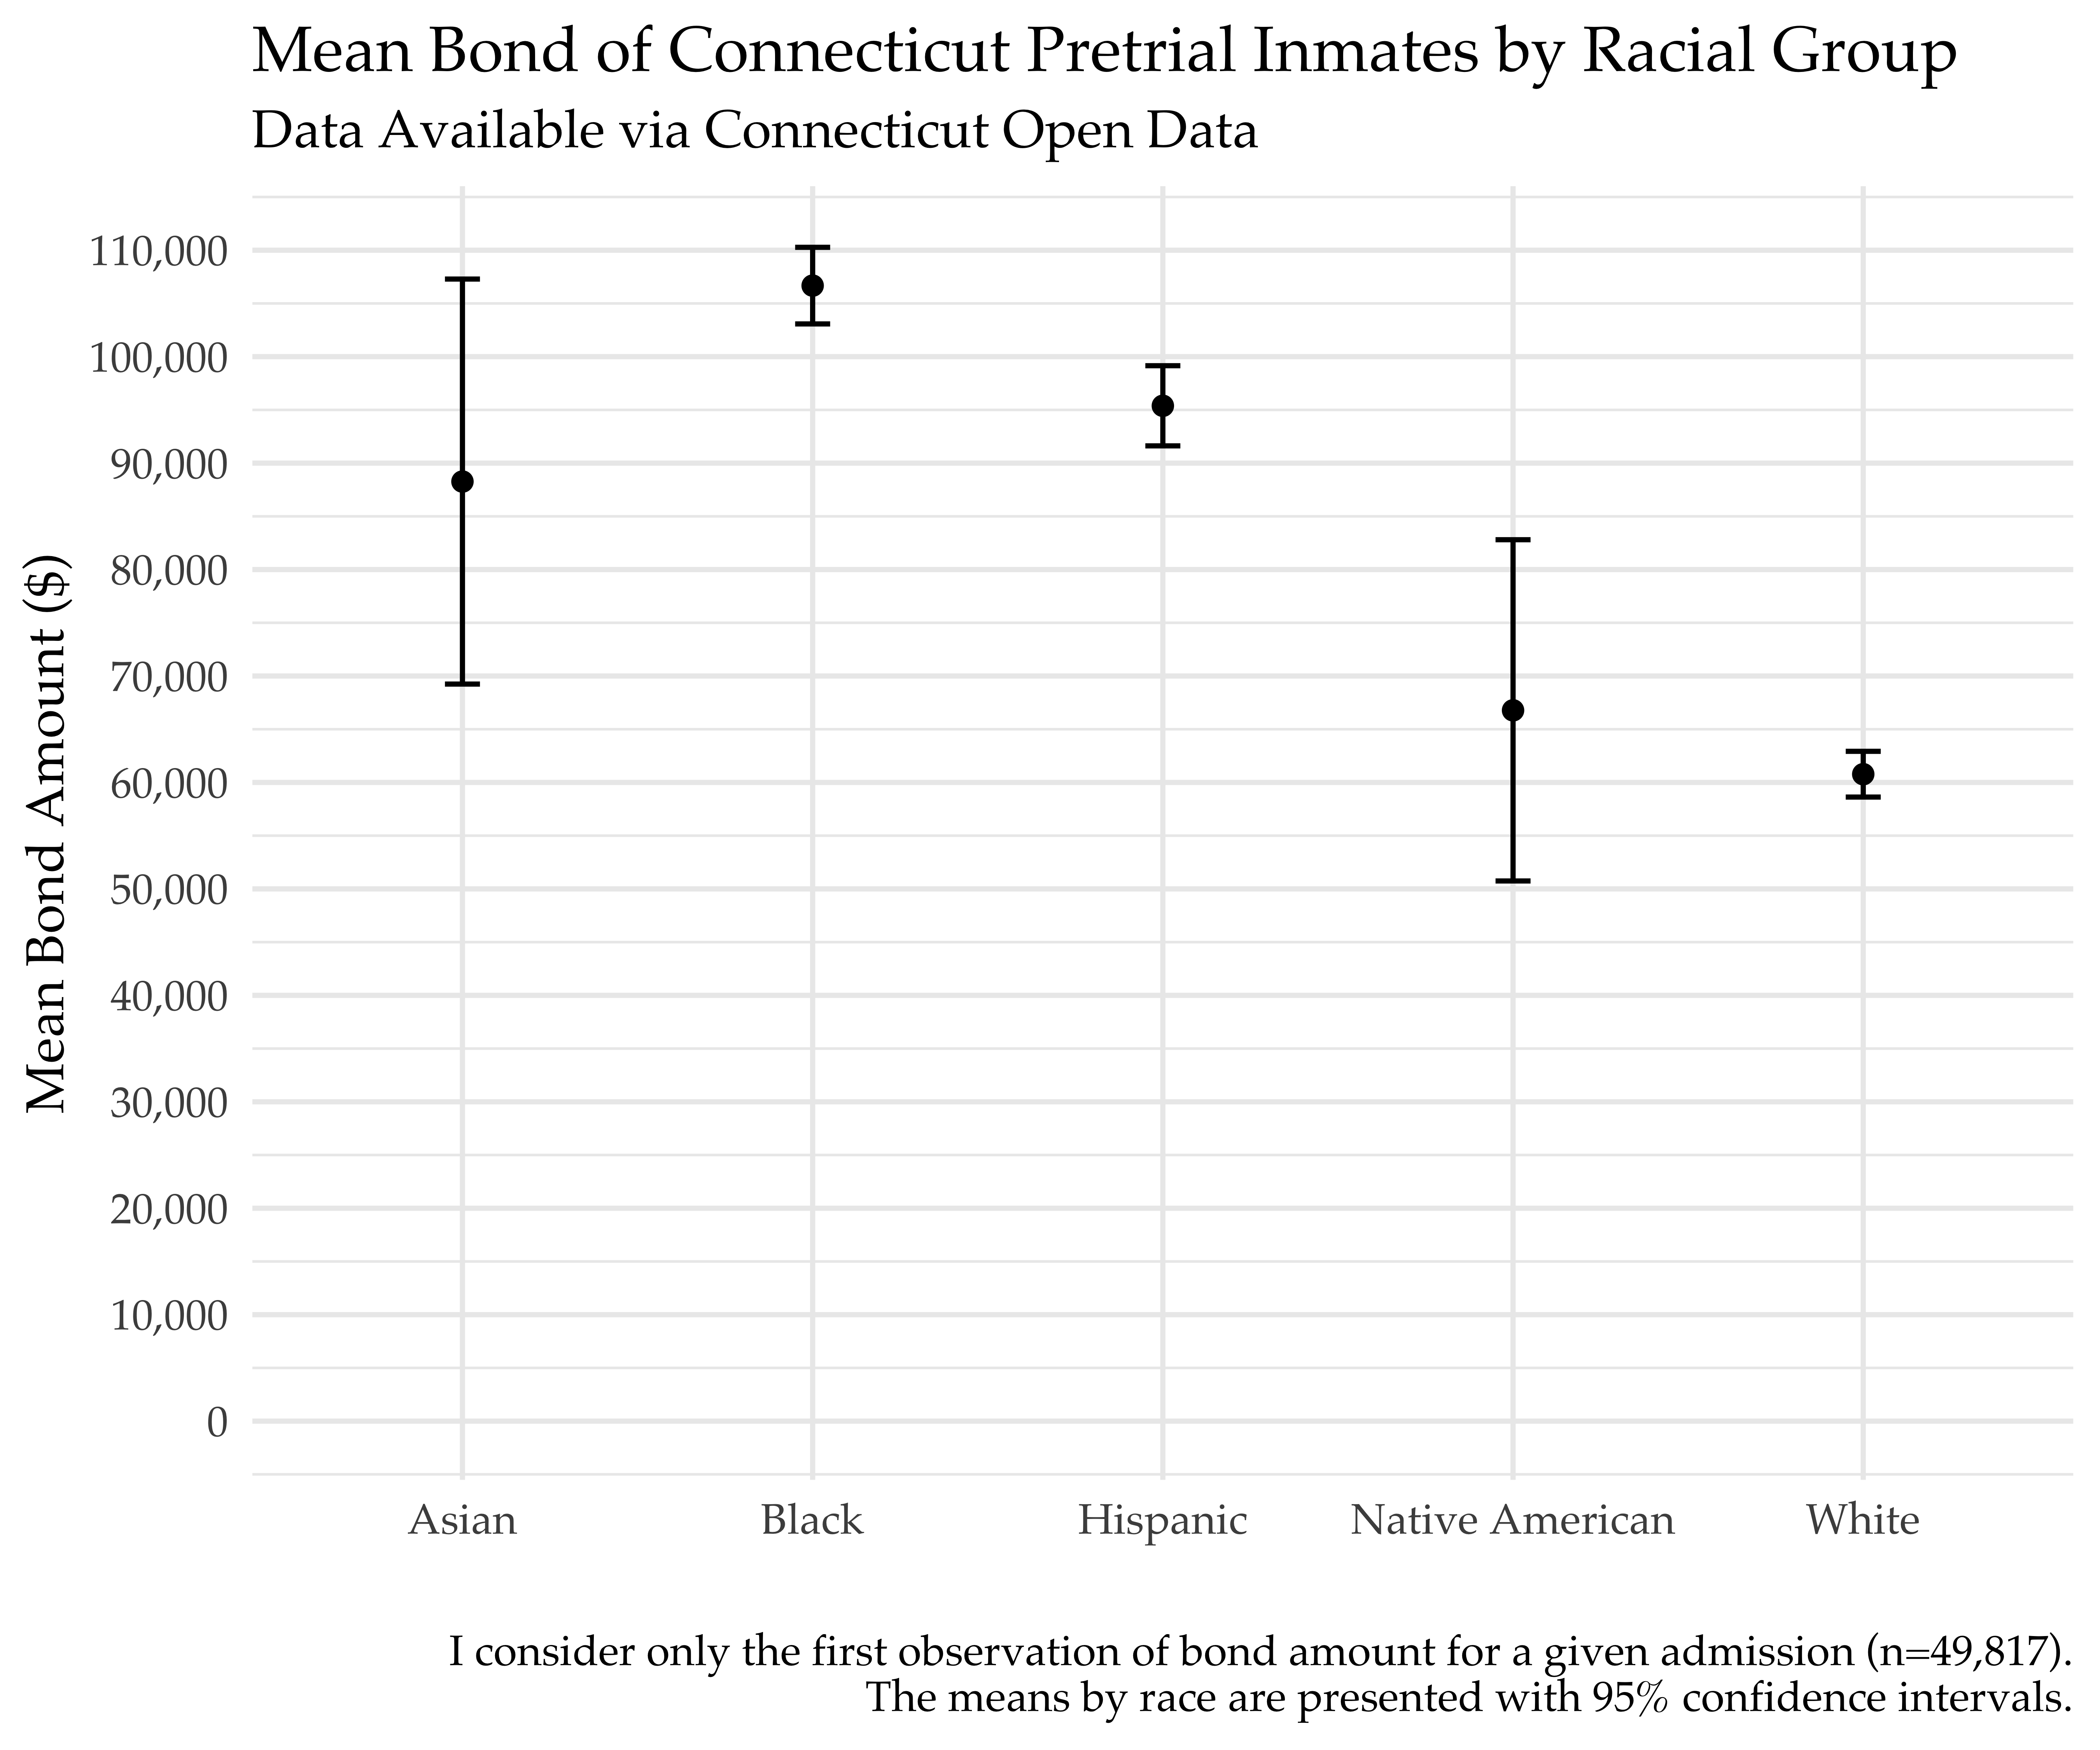
White pretrial inmates have lower bonds on average than black, Asian, or Hispanic pretrial inmates.14
However, the pretrial inmate population is not the same as the overall pretrial population – many pretrial defendants are not detained because they are able to pay bail (or were given ROR). As such, we do not know the average bond amounts by race for the complete population.
4. How long do people stay in jail pretrial?
Recall, you can get out of pretrial detention if you pay bond or if your case is disposed – that is, your case is dismissed, you plead out, you go to trial, etc. Over the 46,722 observations of jail stay (excluding people who never got out and subsetting to those with stable demographics), the duration of a pretrial jail stay15 ranges from 1 to 1,038 days, with a mean of 64 days and a median of 28 days. (That is a median of 4 weeks.)
Let’s plot the distribution of length of jail stay. Again, I use a log10 transformation for the x-axis due to the extreme values present in the data.
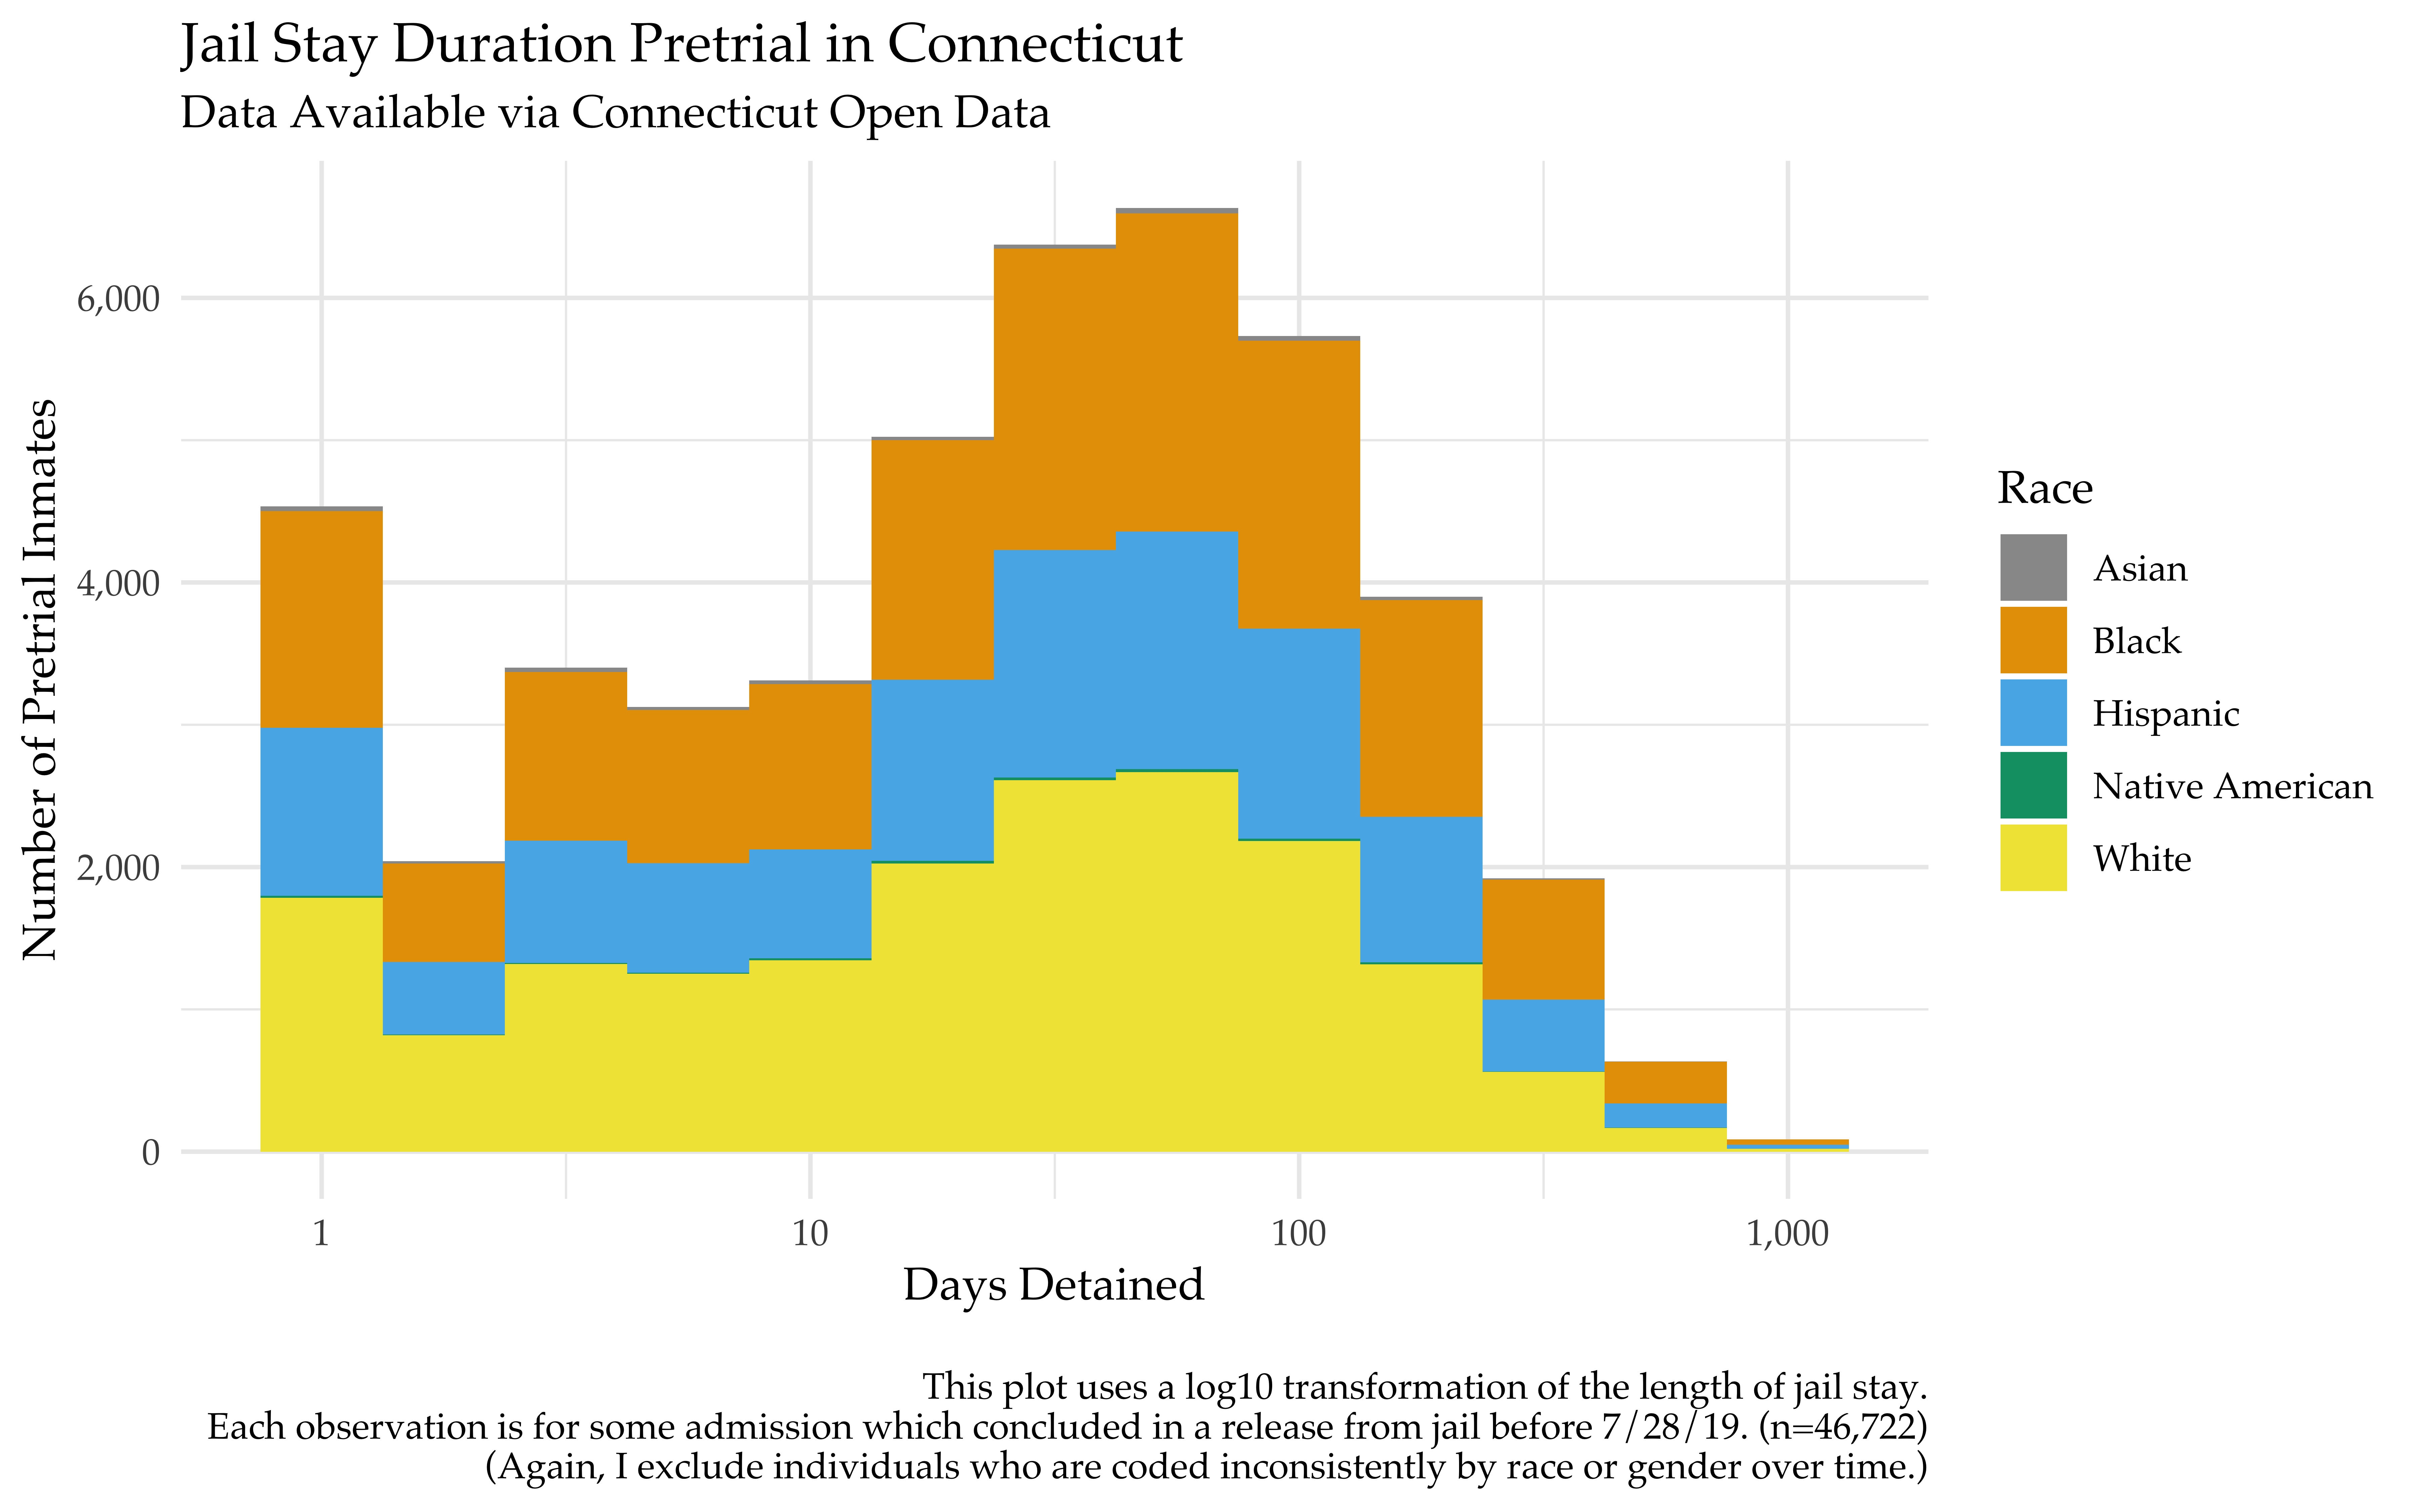
Using this data source, I cannot observe why people are exiting the dataset. That is, I cannot tell whether they paid bail or their case concluded. But, given the usual time until disposition, the mass around 1 day is likely from paying, while the mass at and after 100 days is likely due to case disposition.
In comparing means of jail stay by race, the means for black, Hispanic, and white inmates are precise (due to larger sample size) and illustrate that, on average, black inmates tend to stay longer than Hispanic inmates who, in turn, stay longer than white inmates.
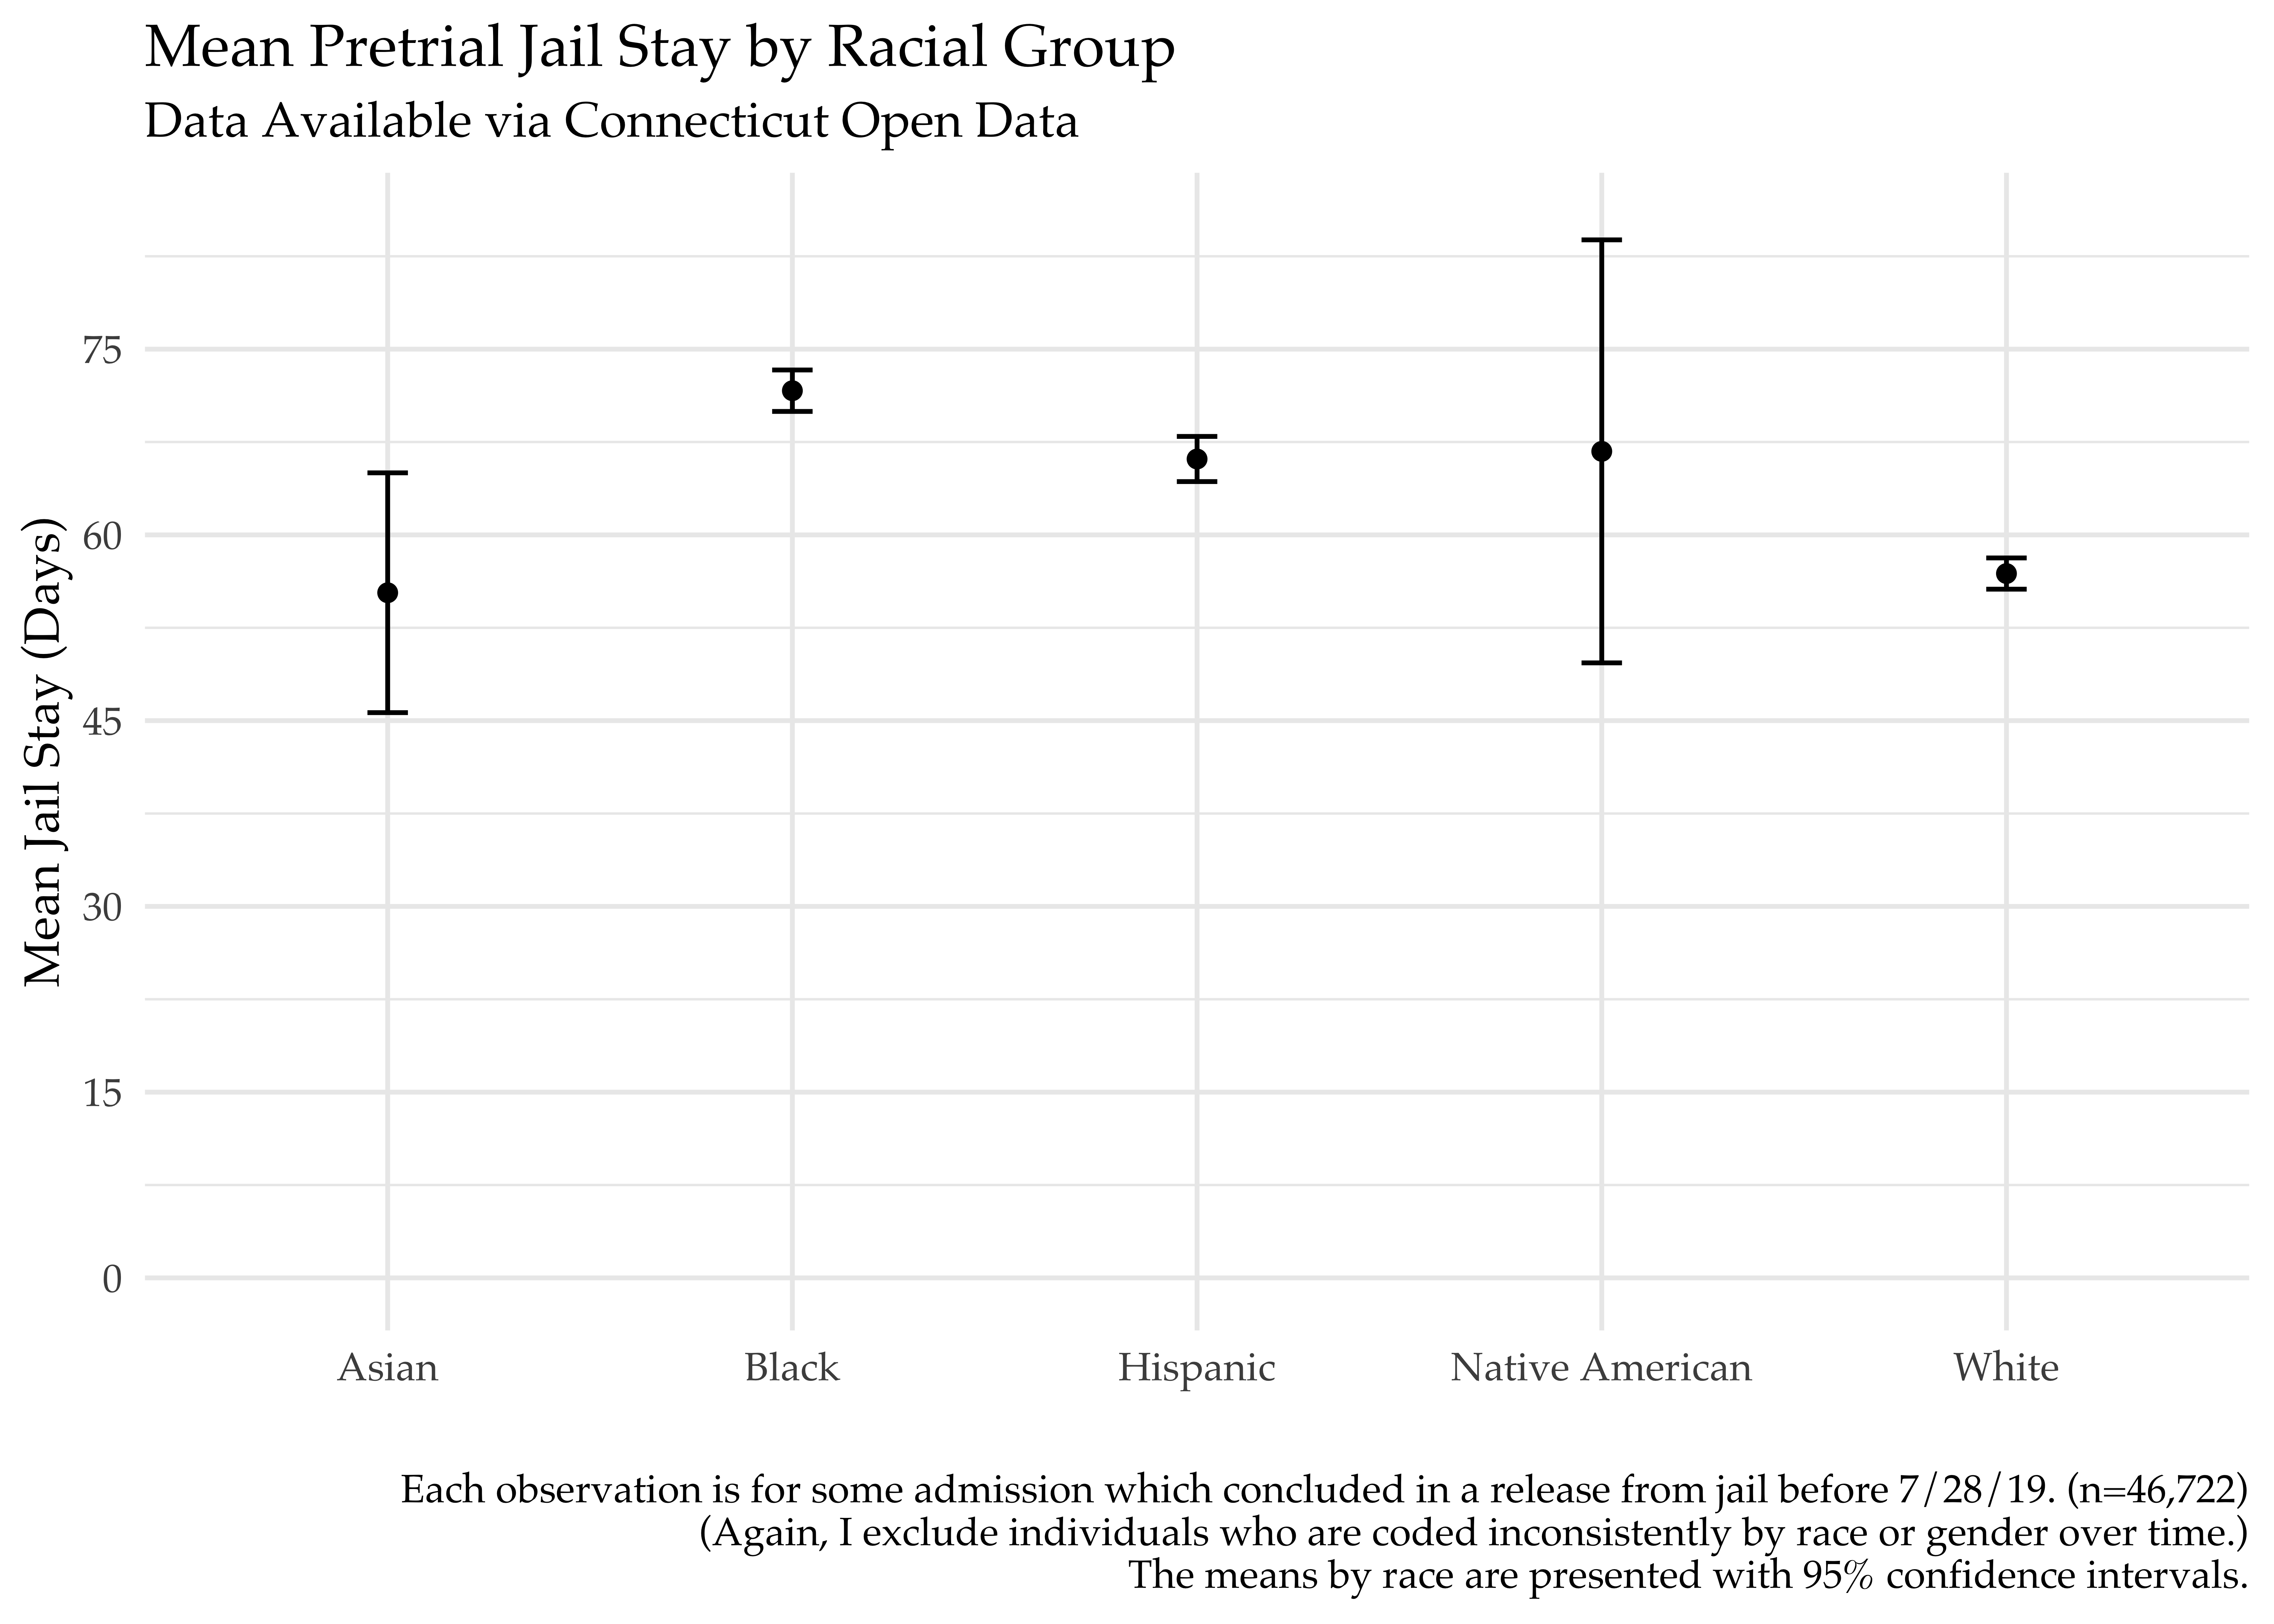
Given that whites had lower original bond on admission than black and Hispanic defendants, the above is to be expected. Given the expected relationship between bond amount and jail stay, lower original bond amounts should mean shorter jail stays (on average). The below section illustrates that relationship explicitly.
5. How does bond relate to length of time in pretrial detention?
In the case of this dataset, there is a correlation coefficient of ~0.37 between duration of stay in jail and bond amount, which aligns with the simple logic that it takes people longer to pay more expensive bond amounts (and then get out of jail).16 To see the joint distribution of the two variables (bond and stay), I display a hexagonal binned plot below.
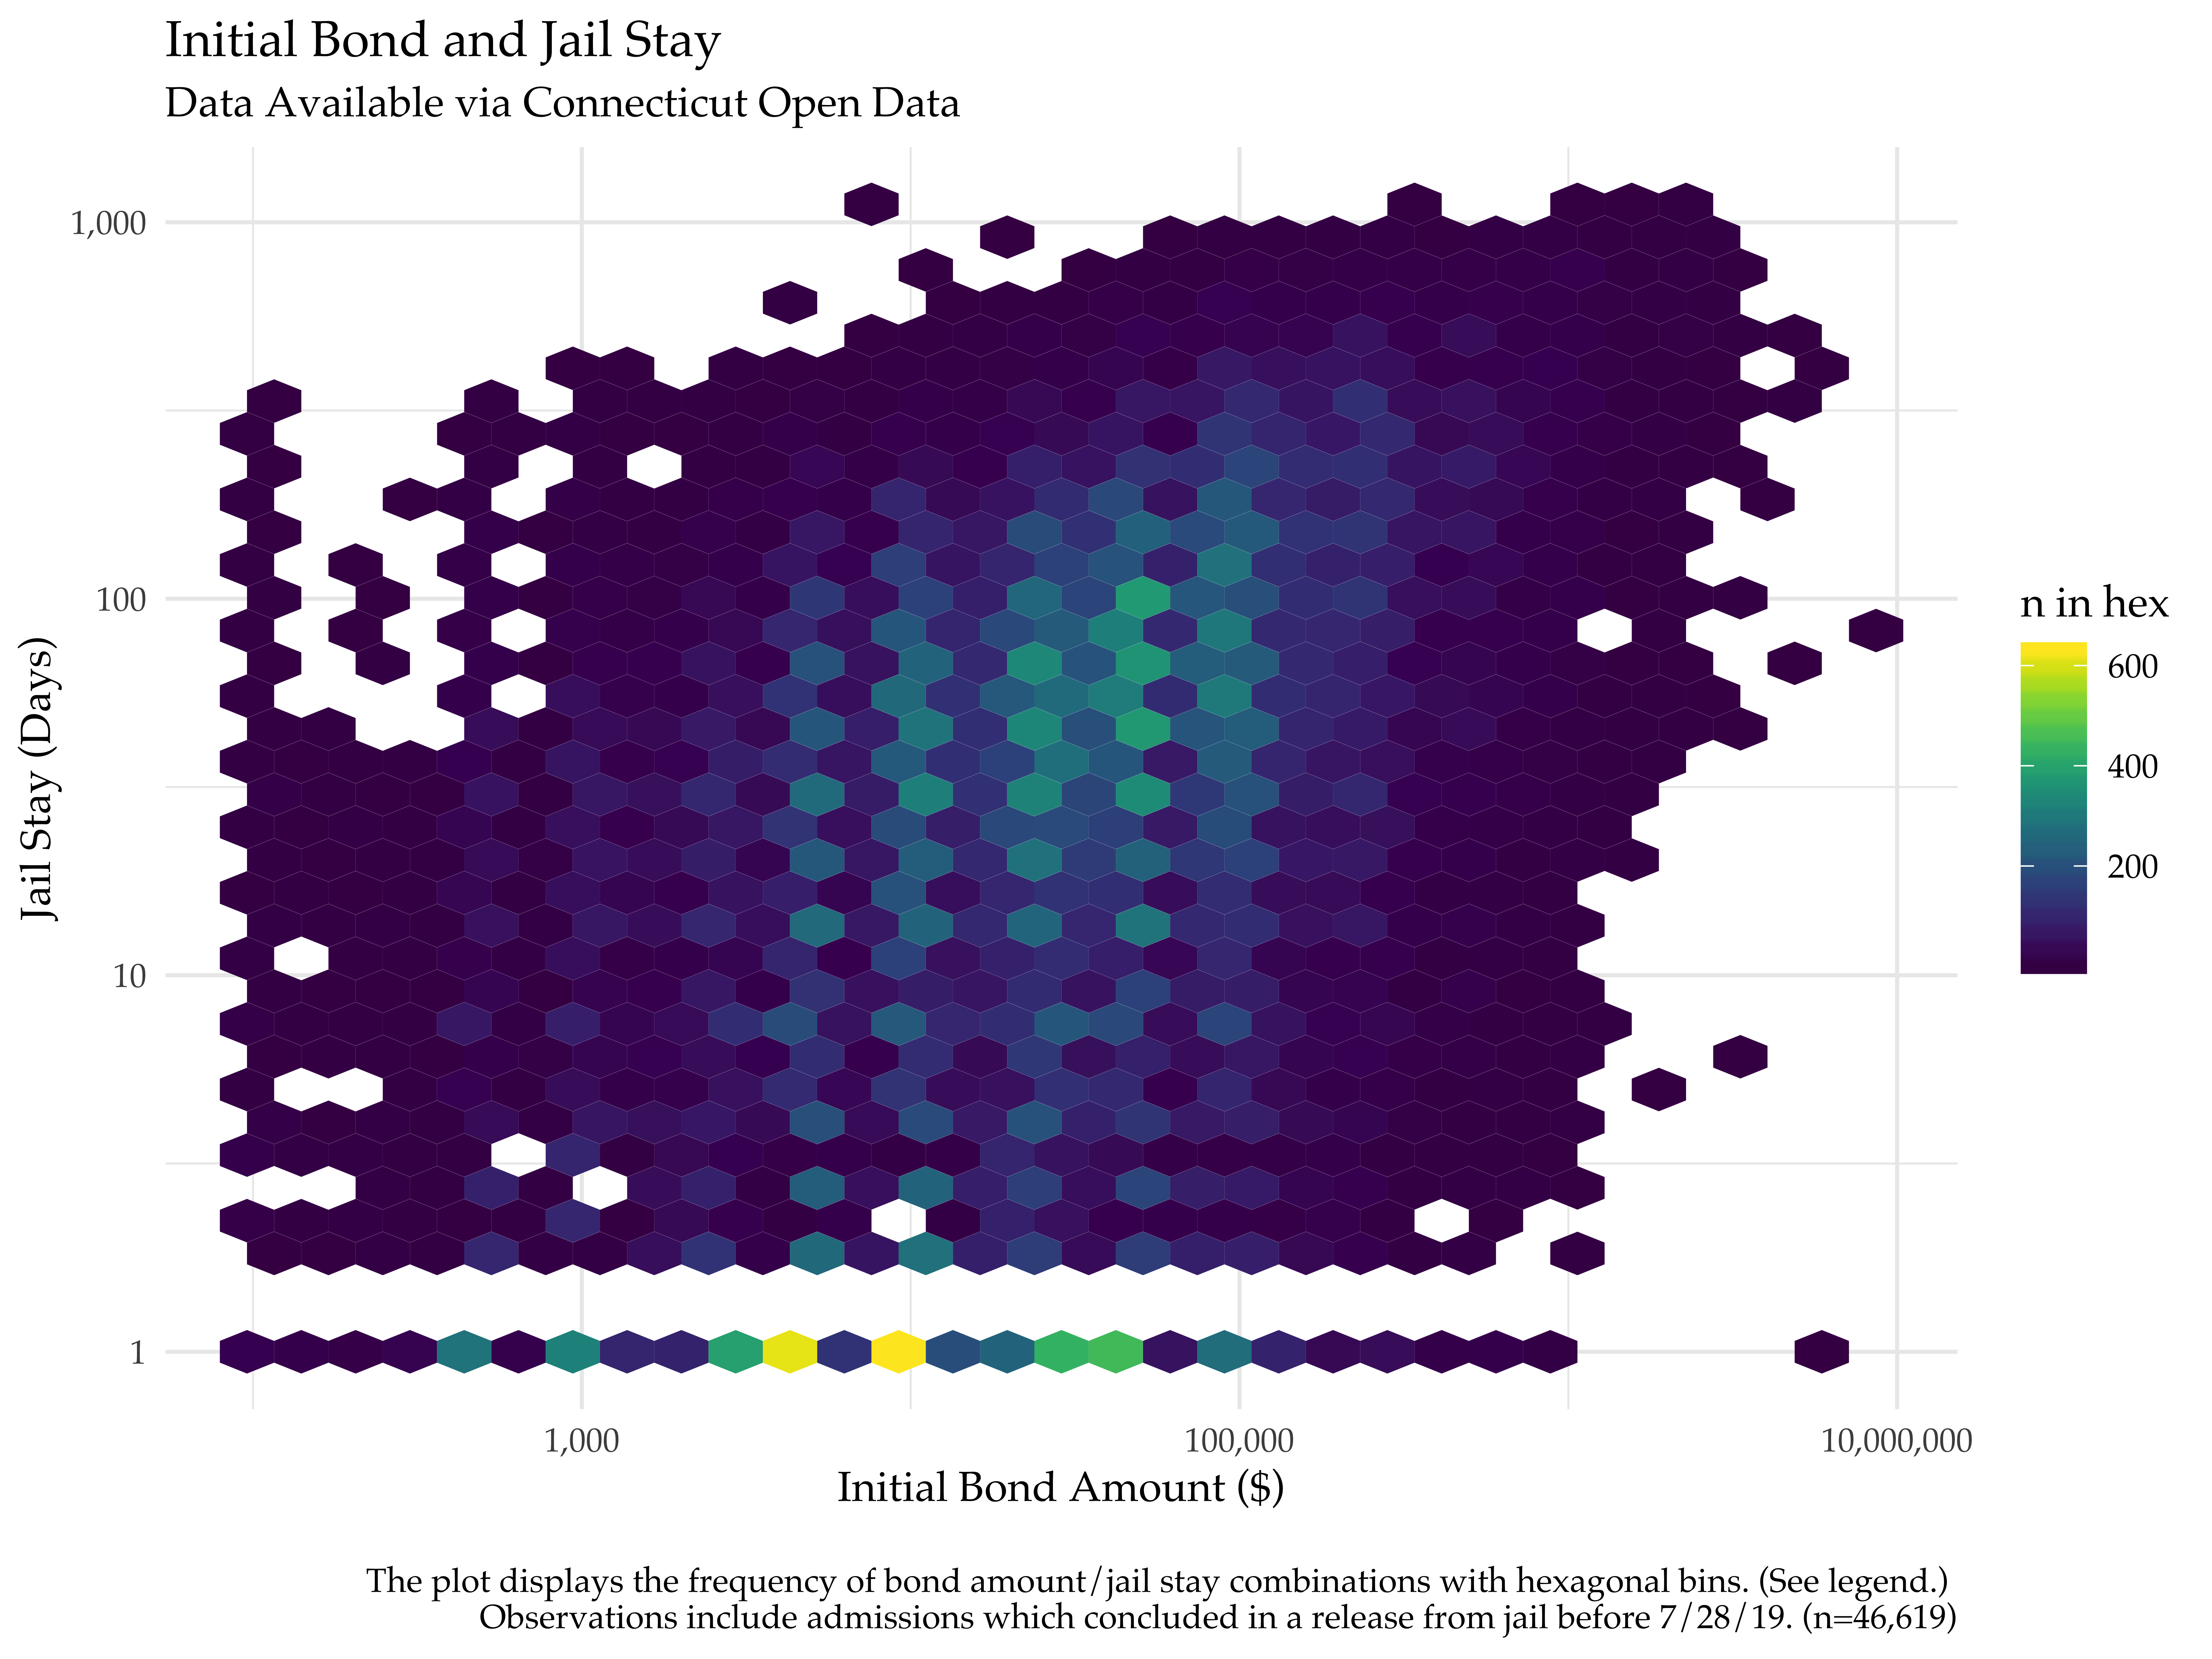
Looking at the colors of the hexagons, it’s readily apparent that the most common scenario (bright yellow) for people in the data is release within 1 day at bond of around $10,000. Northeast of those yellow hexagons, there is also a warmspot (light green) of hexagons (demonstrating a mass of observations) in the area just short of $100,000 and 100 jail days.
Conclusion & the future of jail data
These graphs and stats use open data to give some descriptive information on the pretrial inmate population in Connecticut. Some big take-aways are (in order of illustration):
- violations of probation/conditional discharge are the largest driver of pretrial jail admissions in Connecticut
- black and Hispanic people (mainly, black and Hispanic men) are over-represented in the Connecticut pretrial inmate population17
- there are shockingly large ranges of bond amounts and pretrial jail stay durations (so much so I have to use
log10transformations for visuals) - black and Hispanic pretrial inmates face higher bond amounts and stay in jail pretrial longer than white pretrial inmates
- there is not a perfect correlation between bond amount and jail stay for this population, but there is a correlation that aligns with basic intuition
Investigating pretrial inmate populations at a more national level (moving beyond Connecticut) requires more high frequency jail data. (More states, more counties, please.) When I first drafted this article, I was bummed to end on a call for better jail data since I was unsure when someone (anyone?) would be able to make this a reality. However, on the exact same day I revisited this Connecticut data (7/28/19), NYU’s Public Safety Lab announced the launch of their Jail Data Initiative. In describing this new project, they explain,
our data science team is crawling daily county jail rosters and criminal case records in over 1,000 counties. Using these data we will be able both to identify counties that are systematically jailing defendants pre-trial and/or post-fine, and to estimate the impacts of these practices on recidivism.
So, with this recent launch in mind, I am happy to report that future investigations into pretrial practices and populations won’t be limited to Connecticut.
Data/Code
- The pretrial inmate dataset is available via Connecticut Open data here
- See here for my R notebook
- See here for my Github repo
-
Given that 97% of federal cases and 94% of state cases are resolved with plea deals, perhaps we should more accurately call them “pre-plea” inmates. ↩︎
-
Previously, I estimated that ~2.5-4.5 million unique people flow through pretrial detention in a year. ↩︎
-
Note: I also used this data in a January post about the dynamics of pretrial populations. ↩︎
-
Some technical notes: (1) Since the DOC is a State agency, the data doesn’t include those with federal charges or those in the Juvenile Justice system. (2) Defendant characteristics (e.g., race and age) are self-reported by inmates upon intake. ↩︎
-
I.e., if you were detained and then released during the same day (before the nightly count), then you would not be recorded. ↩︎
-
Think person-admission-charge. ↩︎
-
Note: This is not the same picture as you would get for the most common charge across days in jail. The measure based on days in jail would be weighting by jail stay duration, which would skew towards more serious offenses (since more serious charges mean higher bail, leading to smaller likelihood of release). ↩︎
-
These are charges that are based on specific agreements with criminal justice system actors. ↩︎
-
FTA feels conceptually more similar to a violation of conditions than a new charge that is independent of criminal justice system interactions to me. ↩︎
-
Note that in the Census, Hispanic is not a race; Hispanic/Latinx is an ethnicity. As such, the racial groups in the DOC data don’t map perfectly onto the Census figures. ↩︎
-
Most recent as of my download. ↩︎
-
I exclude bond amounts of less than $100 because the codebook says that “in some instances, for particularly low (less than $100), this bond amount may be considered a place holder value”. There are only 104 observations of first bond under $100. ↩︎
-
(But it is pretty.) ↩︎
-
This statement is not adjusting for offense or other demographic characteristics. Running simple OLS regressions on this data with log(bond) as the dependent variable and race/gender/age controls, being black is associated with a 39.9% higher bond. Once adjusting for offense dummies as well, this drops to 15.1%. ↩︎
-
I count how many times defendants are in the data for a given admission date. ↩︎
-
Recall: the data observed here is limited to those present in jail during some night, so it is a subset of the true set of observations on bond and pretrial detention. On another note, this relationship is weaker than one might expect – I’m open to thoughts on this. ↩︎
-
This is unsurprising as it mimics the general facts about over-representation in the US criminal justice system. ↩︎